
- Start >
- Rivers >
- Discharge >
- Naab - Regen >
- Iglersreuth Speicherzufluss >
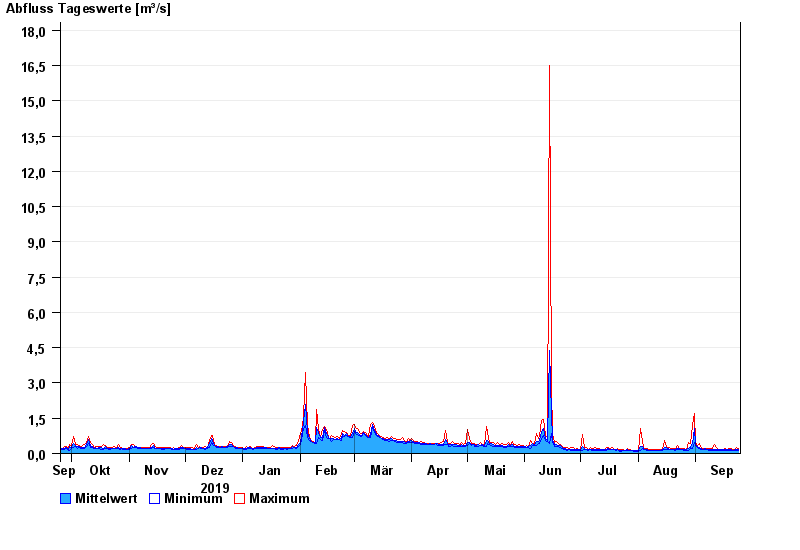
- Chart of year

Chart of year Iglersreuth Speicherzufluss / Tirschenreuther Waldnaab
Discharge from 25.09.2019 to 24.09.2020
| Date | Mean value [m³/s] | Maximum [m³/s] | Minimum [m³/s] |
|---|---|---|---|
| 24.09.2020 | 0.168 | 0.21 | 0.148 |
| 23.09.2020 | 0.172 | 0.234 | 0.131 |
| 22.09.2020 | 0.15 | 0.188 | 0.131 |
| 21.09.2020 | 0.147 | 0.188 | 0.131 |
| 20.09.2020 | 0.167 | 0.21 | 0.115 |
| 19.09.2020 | 0.158 | 0.21 | 0.131 |
| 18.09.2020 | 0.158 | 0.187 | 0.148 |
© Bayerisches Landesamt für Umwelt 2024