
- Start >
- Rivers >
- Discharge >
- Naab - Regen >
- Iglersreuth Speicherzufluss >
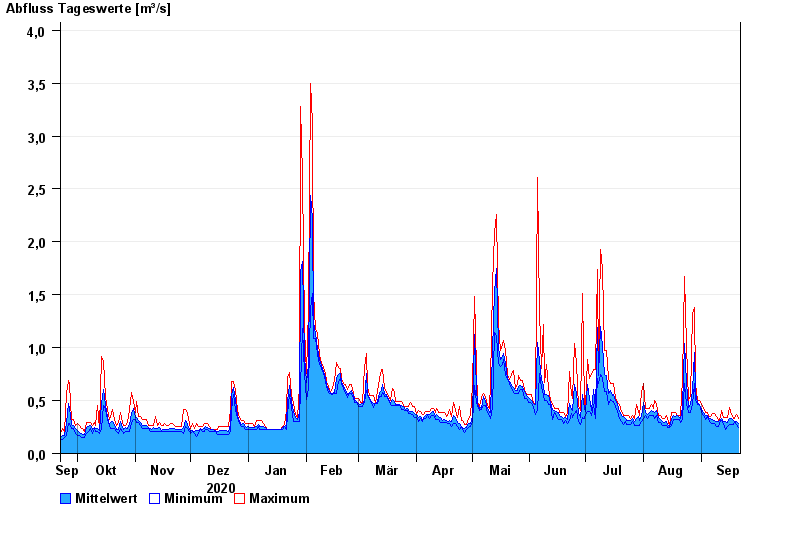
- Chart of year

Chart of year Iglersreuth Speicherzufluss / Tirschenreuther Waldnaab
Discharge from 22.09.2020 to 21.09.2021
| Date | Mean value [m³/s] | Maximum [m³/s] | Minimum [m³/s] |
|---|---|---|---|
| 21.09.2021 | 0.288 | 0.331 | 0.244 |
| 20.09.2021 | 0.299 | 0.364 | 0.272 |
| 19.09.2021 | 0.304 | 0.334 | 0.303 |
| 18.09.2021 | 0.312 | 0.335 | 0.275 |
| 17.09.2021 | 0.334 | 0.369 | 0.276 |
| 16.09.2021 | 0.333 | 0.438 | 0.278 |
| 15.09.2021 | 0.297 | 0.339 | 0.251 |
© Bayerisches Landesamt für Umwelt 2024