
- Start >
- Rivers >
- Discharge >
- Naab - Regen >
- Iglersreuth Speicherzufluss >
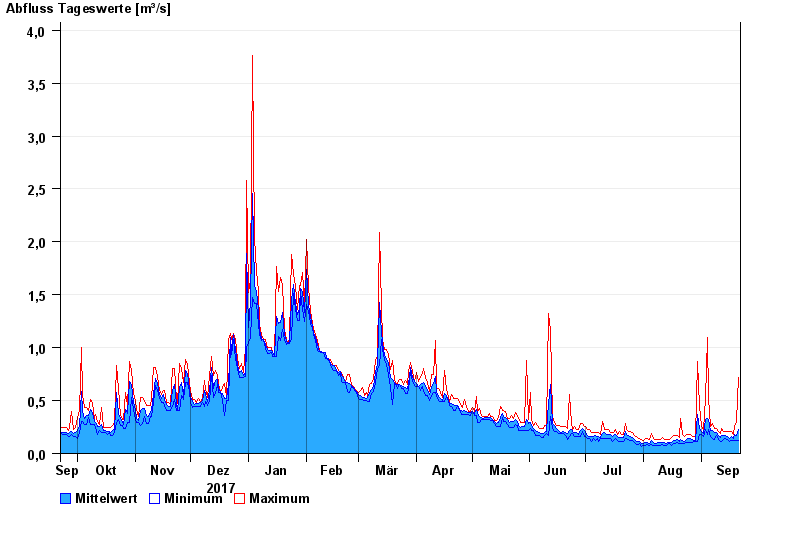
- Chart of year

Chart of year Iglersreuth Speicherzufluss / Tirschenreuther Waldnaab
Discharge from 22.09.2017 to 21.09.2018
| Date | Mean value [m³/s] | Maximum [m³/s] | Minimum [m³/s] |
|---|---|---|---|
| 21.09.2018 | 0.223 | 0.718 | 0.124 |
| 20.09.2018 | 0.17 | 0.307 | 0.125 |
| 19.09.2018 | 0.176 | 0.252 | 0.126 |
| 18.09.2018 | 0.142 | 0.182 | 0.126 |
| 17.09.2018 | 0.161 | 0.205 | 0.127 |
| 16.09.2018 | 0.142 | 0.205 | 0.112 |
| 15.09.2018 | 0.162 | 0.206 | 0.128 |
© Bayerisches Landesamt für Umwelt 2024