
- Start >
- Rivers >
- Discharge >
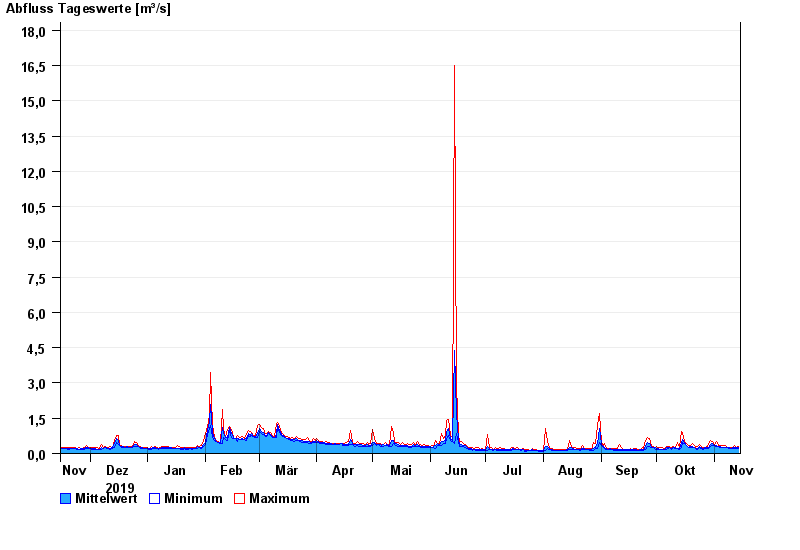
- Naab - Regen >
- Iglersreuth Speicherzufluss >
- Chart of year

Chart of year Iglersreuth Speicherzufluss / Tirschenreuther Waldnaab
Discharge from 15.11.2019 to 14.11.2020
| Date | Mean value [m³/s] | Maximum [m³/s] | Minimum [m³/s] |
|---|---|---|---|
| 14.11.2020 | 0.243 | 0.289 | 0.21 |
| 13.11.2020 | 0.238 | 0.261 | 0.211 |
| 12.11.2020 | 0.234 | 0.351 | 0.211 |
| 11.11.2020 | 0.241 | 0.261 | 0.211 |
| 10.11.2020 | 0.229 | 0.261 | 0.211 |
| 09.11.2020 | 0.239 | 0.261 | 0.211 |
| 08.11.2020 | 0.247 | 0.262 | 0.235 |
© Bayerisches Landesamt für Umwelt 2024