
- Start >
- Rivers >
- Discharge >
- Naab - Regen >
- Iglersreuth Speicherzufluss >
- Chart of year

Chart of year Iglersreuth Speicherzufluss / Tirschenreuther Waldnaab
Discharge from 21.11.2019 to 20.11.2020
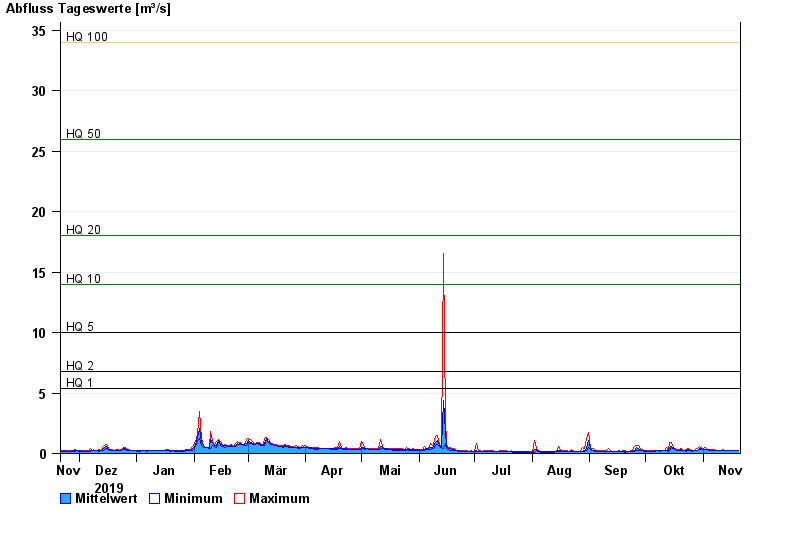
- HQ1 5,4 m³/s
- HQ2 6,8 m³/s
- HQ5 10 m³/s
- HQ10 14 m³/s
- HQ20 18 m³/s
- HQ50 26 m³/s
- HQ100 34 m³/s
| Date | Mean value [m³/s] | Maximum [m³/s] | Minimum [m³/s] |
|---|---|---|---|
| 20.11.2020 | 0.237 | 0.288 | 0.21 |
| 19.11.2020 | 0.225 | 0.26 | 0.21 |
| 18.11.2020 | 0.225 | 0.26 | 0.21 |
| 17.11.2020 | 0.23 | 0.288 | 0.21 |
| 16.11.2020 | 0.23 | 0.26 | 0.21 |
| 15.11.2020 | 0.222 | 0.261 | 0.21 |
| 14.11.2020 | 0.243 | 0.289 | 0.21 |
© Bayerisches Landesamt für Umwelt 2024