
- Start >
- Rivers >
- Discharge >
- Naab - Regen >
- Iglersreuth Speicherzufluss >
- Chart of total period

Chart of total period Iglersreuth Speicherzufluss / Tirschenreuther Waldnaab
Discharge from 01.11.1970 to 27.04.2024
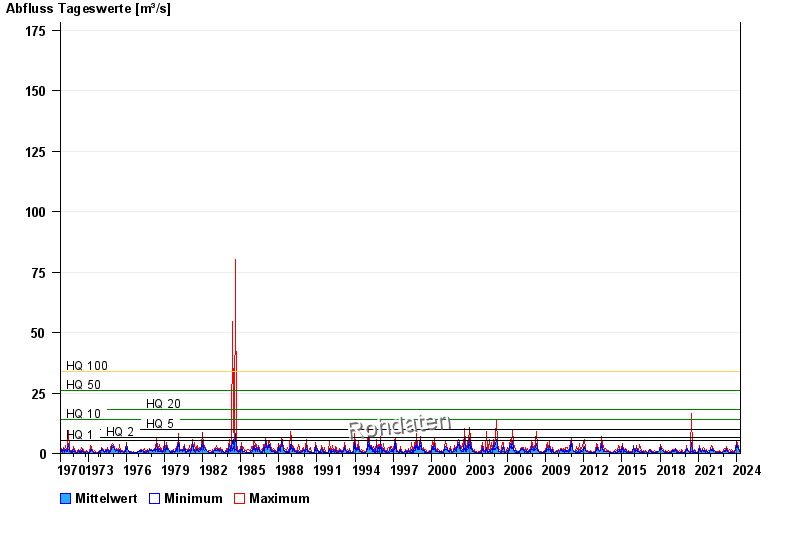
- HQ1 5,4 m³/s
- HQ2 6,8 m³/s
- HQ5 10 m³/s
- HQ10 14 m³/s
- HQ20 18 m³/s
- HQ50 26 m³/s
- HQ100 34 m³/s
| Date | Mean value [m³/s] | Maximum [m³/s] | Minimum [m³/s] |
|---|---|---|---|
| 27.04.2024 | 0.61 | 0.625 | 0.583 |
| 26.04.2024 | 0.639 | 0.666 | 0.583 |
| 25.04.2024 | 0.665 | 0.71 | 0.625 |
| 24.04.2024 | 0.693 | 0.752 | 0.666 |
| 23.04.2024 | 0.763 | 0.841 | 0.71 |
| 22.04.2024 | 0.852 | 0.982 | 0.797 |
| 21.04.2024 | 0.895 | 1.13 | 0.752 |
© Bayerisches Landesamt für Umwelt 2024