
- Start >
- Rivers >
- Discharge >
- Naab - Regen >
- Hammermühle >
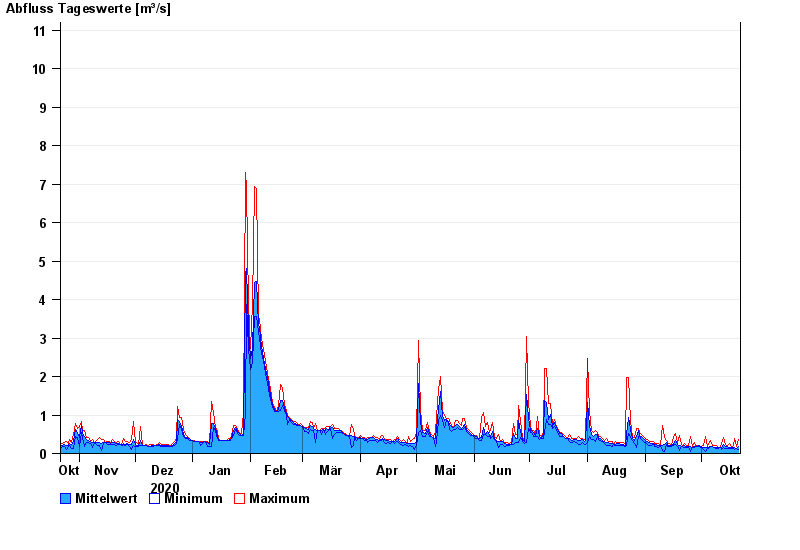
- Chart of year

Chart of year Hammermühle / Otterbach
Discharge from 22.10.2020 to 21.10.2021
- 31.05.2013 Abfluss: 32,1 m³/s
- 03.06.2013 Abfluss: 30,6 m³/s
- 21.12.1993 Abfluss: 29,7 m³/s
- 25.03.1988 Abfluss: 25,9 m³/s
- 02.02.1985 Abfluss: 24,1 m³/s
| Date | Mean value [m³/s] | Maximum [m³/s] | Minimum [m³/s] |
|---|---|---|---|
| 21.10.2021 | 0.181 | 0.355 | 0.101 |
| 20.10.2021 | 0.141 | 0.184 | 0.118 |
| 19.10.2021 | 0.147 | 0.402 | 0.102 |
| 18.10.2021 | 0.159 | 0.214 | 0.138 |
| 17.10.2021 | 0.155 | 0.162 | 0.139 |
| 16.10.2021 | 0.163 | 0.25 | 0.121 |
| 15.10.2021 | 0.173 | 0.219 | 0.141 |
© Bayerisches Landesamt für Umwelt 2024