
- Start >
- Rivers >
- Discharge >
- Naab - Regen >
- Hammermühle >
- Chart of year

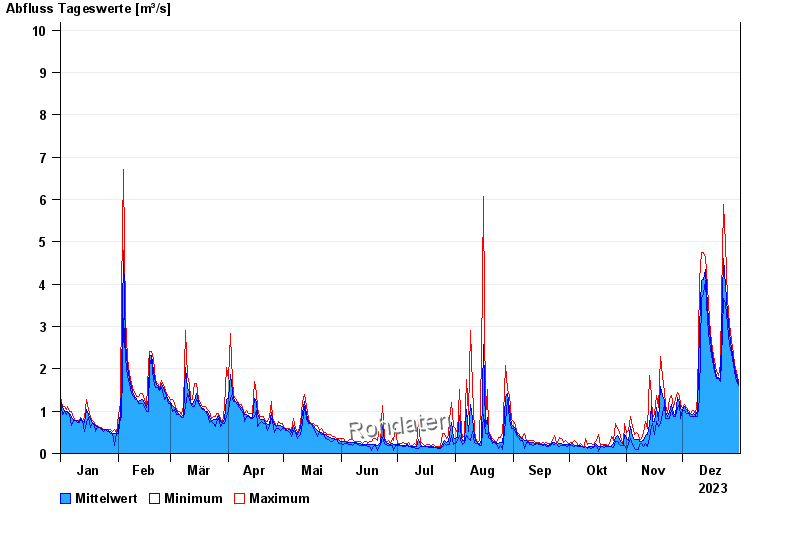
Chart of year Hammermühle / Otterbach
Discharge from 01.01.2023 to 31.12.2023
- 31.05.2013 Abfluss: 32,1 m³/s
- 03.06.2013 Abfluss: 30,6 m³/s
- 21.12.1993 Abfluss: 29,7 m³/s
- 25.03.1988 Abfluss: 25,9 m³/s
- 02.02.1985 Abfluss: 24,1 m³/s
| Date | Mean value [m³/s] | Maximum [m³/s] | Minimum [m³/s] |
|---|---|---|---|
| 31.12.2023 | 1.64 | 1.69 | 1.61 |
| 30.12.2023 | 1.82 | 1.94 | 1.69 |
| 29.12.2023 | 2.02 | 2.1 | 1.94 |
| 28.12.2023 | 2.22 | 2.37 | 2.1 |
| 27.12.2023 | 2.48 | 2.66 | 2.37 |
| 26.12.2023 | 2.84 | 3.04 | 2.56 |
| 25.12.2023 | 3.33 | 3.66 | 3.04 |
© Bayerisches Landesamt für Umwelt 2024