
- Start >
- Rivers >
- Discharge >
- Naab - Regen >
- Hammerles >
- Chart of year

Chart of year Hammerles / Schweinnaab
Discharge from 12.07.2020 to 11.07.2021
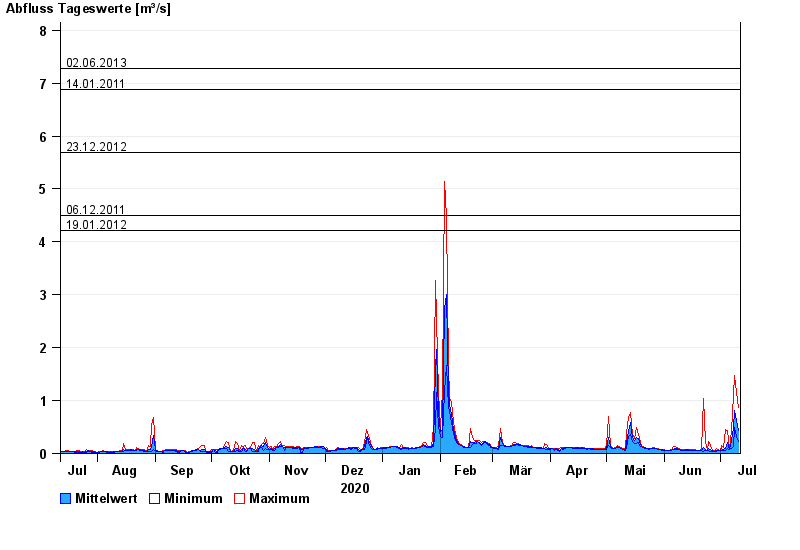
- 02.06.2013 Abfluss: 7,27 m³/s
- 14.01.2011 Abfluss: 6,88 m³/s
- 23.12.2012 Abfluss: 5,69 m³/s
- 06.12.2011 Abfluss: 4,5 m³/s
- 19.01.2012 Abfluss: 4,22 m³/s
| Date | Mean value [m³/s] | Maximum [m³/s] | Minimum [m³/s] |
|---|---|---|---|
| 11.07.2021 | 0.443 | 0.868 | 0.226 |
| 10.07.2021 | 0.633 | 1.16 | 0.318 |
| 09.07.2021 | 0.81 | 1.47 | 0.483 |
| 08.07.2021 | 0.483 | 1.09 | 0.13 |
| 07.07.2021 | 0.254 | 0.429 | 0.099 |
| 06.07.2021 | 0.081 | 0.099 | 0.068 |
| 05.07.2021 | 0.201 | 0.432 | 0.099 |
© Bayerisches Landesamt für Umwelt 2024