
- Start >
- Rivers >
- Discharge >
- Naab - Regen >
- Hammerles >
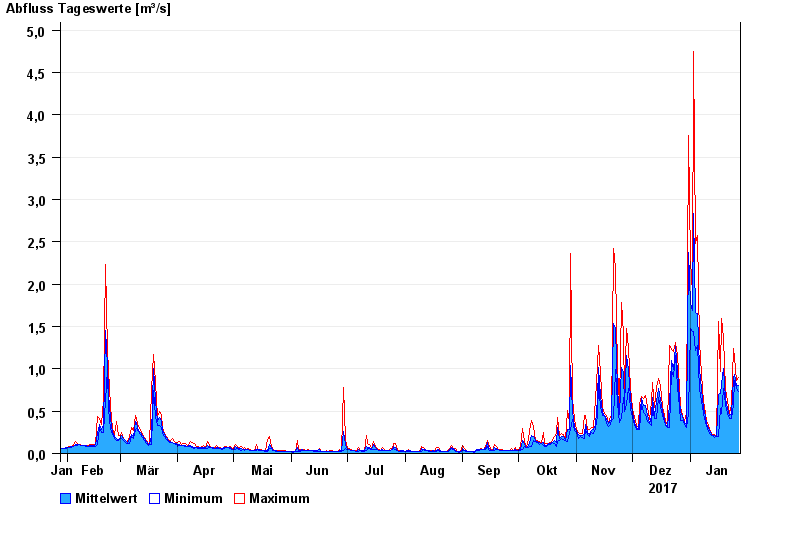
- Chart of year

Chart of year Hammerles / Schweinnaab
Discharge from 28.01.2017 to 27.01.2018
| Date | Mean value [m³/s] | Maximum [m³/s] | Minimum [m³/s] |
|---|---|---|---|
| 27.01.2018 | 0.801 | 0.894 | 0.732 |
| 26.01.2018 | 0.796 | 0.859 | 0.762 |
| 25.01.2018 | 0.93 | 1.13 | 0.858 |
| 24.01.2018 | 0.902 | 1.24 | 0.577 |
| 23.01.2018 | 0.456 | 0.577 | 0.414 |
| 22.01.2018 | 0.447 | 0.469 | 0.415 |
| 21.01.2018 | 0.533 | 0.612 | 0.469 |
© Bayerisches Landesamt für Umwelt 2024