
- Start >
- Rivers >
- Discharge >
- Naab - Regen >
- Hammerles >
- Chart of year

Chart of year Hammerles / Schweinnaab
Discharge from 01.01.2023 to 31.12.2023
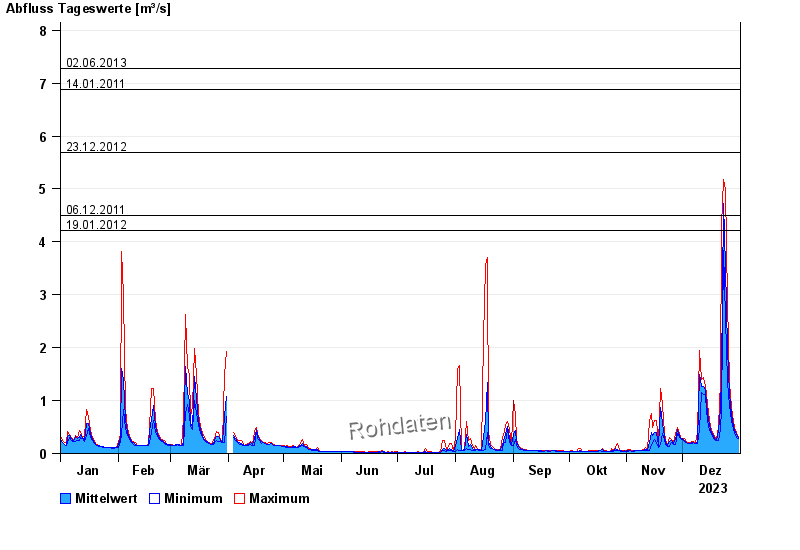
- 02.06.2013 Abfluss: 7,27 m³/s
- 14.01.2011 Abfluss: 6,88 m³/s
- 23.12.2012 Abfluss: 5,69 m³/s
- 06.12.2011 Abfluss: 4,5 m³/s
- 19.01.2012 Abfluss: 4,22 m³/s
| Date | Mean value [m³/s] | Maximum [m³/s] | Minimum [m³/s] |
|---|---|---|---|
| 31.12.2023 | 0.292 | 0.303 | 0.28 |
| 30.12.2023 | 0.363 | 0.404 | 0.303 |
| 29.12.2023 | 0.436 | 0.488 | 0.404 |
| 28.12.2023 | 0.538 | 0.609 | 0.459 |
| 27.12.2023 | 0.732 | 0.872 | 0.609 |
| 26.12.2023 | 1.11 | 1.35 | 0.908 |
| 25.12.2023 | 1.99 | 2.88 | 1.35 |
© Bayerisches Landesamt für Umwelt 2024