
- Start >
- Rivers >
- Discharge >
- Naab - Regen >
- Grafenwöhr >
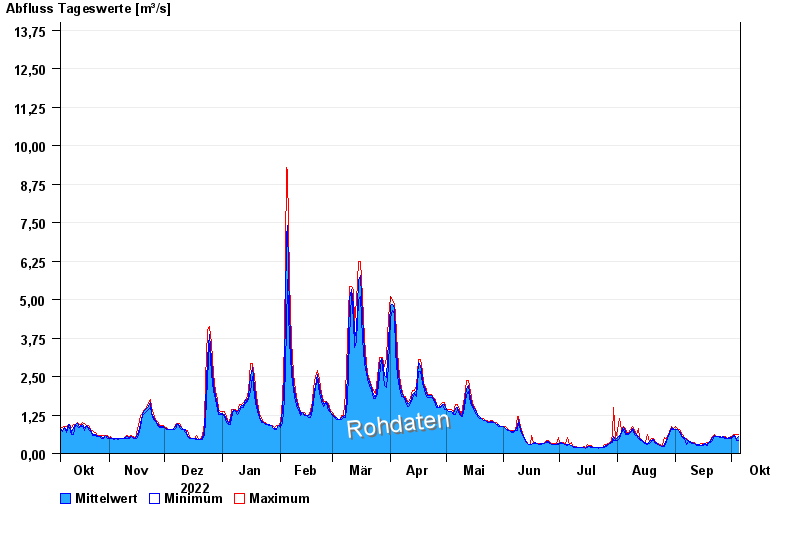
- Chart of year

Chart of year Grafenwöhr / Creußen
Discharge from 06.10.2022 to 05.10.2023
- 26.01.1995 Abfluss: 37,4 m³/s
- 14.01.2011 Abfluss: 36,3 m³/s
- 06.06.1984 Abfluss: 36,2 m³/s
- 03.01.2003 Abfluss: 35,6 m³/s
- 21.12.1993 Abfluss: 34,2 m³/s
| Date | Mean value [m³/s] | Maximum [m³/s] | Minimum [m³/s] |
|---|---|---|---|
| 05.10.2023 | 0.541 | 0.61 | 0.437 |
| 04.10.2023 | 0.499 | 0.61 | 0.437 |
| 03.10.2023 | 0.593 | 0.61 | 0.566 |
| 02.10.2023 | 0.57 | 0.61 | 0.566 |
| 01.10.2023 | 0.511 | 0.566 | 0.478 |
| 30.09.2023 | 0.517 | 0.521 | 0.478 |
| 29.09.2023 | 0.478 | 0.478 | 0.478 |
© Bayerisches Landesamt für Umwelt 2024