
- Start >
- Rivers >
- Discharge >
- Naab - Regen >
- Grafenwöhr >
- Chart of year

Chart of year Grafenwöhr / Creußen
Discharge from 01.01.2020 to 31.12.2020
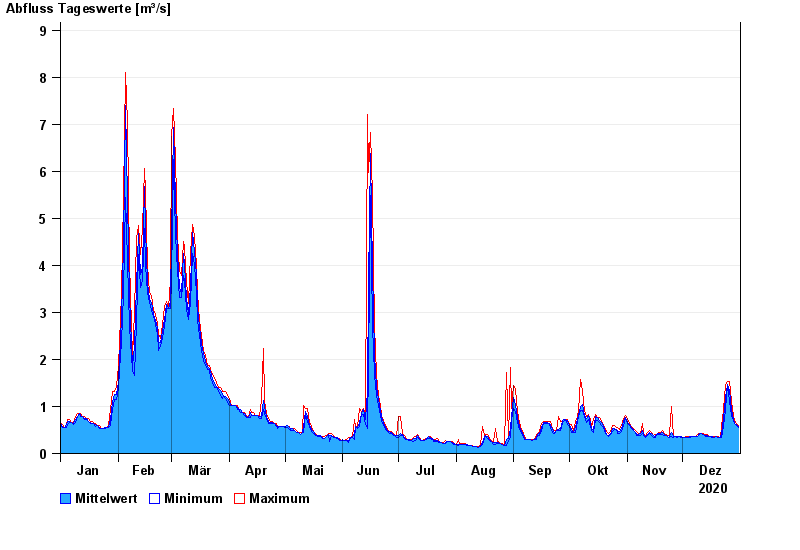
| Date | Mean value [m³/s] | Maximum [m³/s] | Minimum [m³/s] |
|---|---|---|---|
| 31.12.2020 | 0.565 | 0.592 | 0.546 |
| 30.12.2020 | 0.611 | 0.641 | 0.592 |
| 29.12.2020 | 0.643 | 0.694 | 0.641 |
| 28.12.2020 | 0.724 | 0.813 | 0.694 |
| 27.12.2020 | 0.933 | 1.1 | 0.813 |
| 26.12.2020 | 1.34 | 1.54 | 1.1 |
| 25.12.2020 | 1.47 | 1.54 | 1.45 |
© Bayerisches Landesamt für Umwelt 2024