
- Start >
- Rivers >
- Discharge >
- Naab - Regen >
- Grafenwöhr >
- Chart of total period

Chart of total period Grafenwöhr / Creußen
Discharge from 01.11.1957 to 26.04.2024
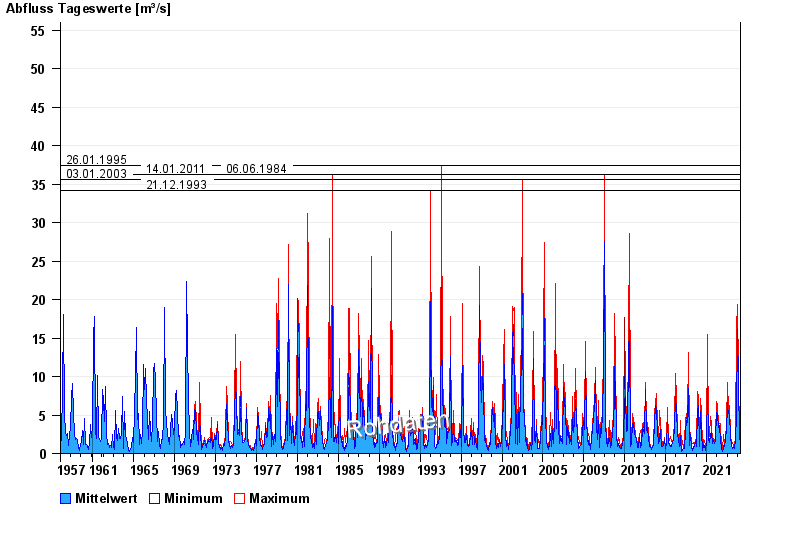
- 26.01.1995 Abfluss: 37,4 m³/s
- 14.01.2011 Abfluss: 36,3 m³/s
- 06.06.1984 Abfluss: 36,2 m³/s
- 03.01.2003 Abfluss: 35,6 m³/s
- 21.12.1993 Abfluss: 34,2 m³/s
| Date | Mean value [m³/s] | Maximum [m³/s] | Minimum [m³/s] |
|---|---|---|---|
| 26.04.2024 | 1.74 | 1.8 | 1.61 |
| 25.04.2024 | 2.06 | 2.31 | 1.8 |
| 24.04.2024 | 2.67 | 3.07 | 2.31 |
| 23.04.2024 | 3.33 | 3.42 | 3.07 |
| 22.04.2024 | 3.02 | 3.42 | 2.62 |
| 21.04.2024 | 2.42 | 2.52 | 2.2 |
| 20.04.2024 | 1.82 | 2.2 | 1.61 |
© Bayerisches Landesamt für Umwelt 2024