
- Start >
- Rivers >
- Discharge >
- Naab - Regen >
- Gogl-Mühle >
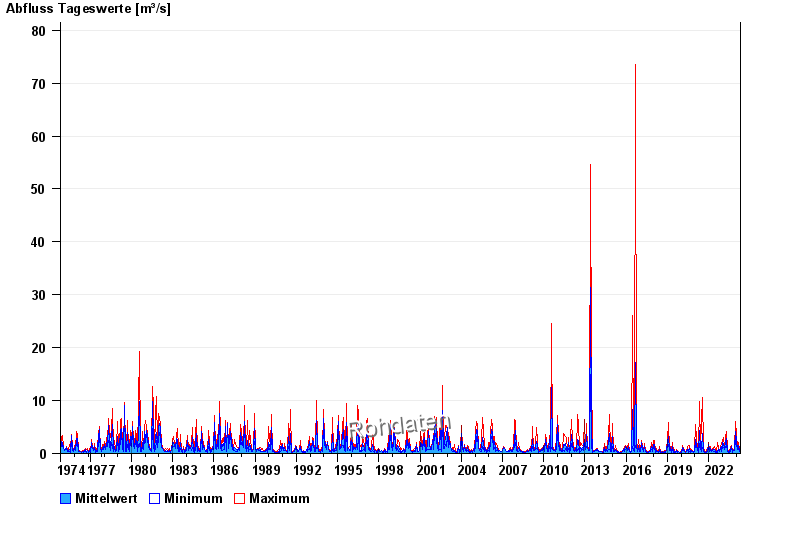
- Chart of total period

Chart of total period Gogl-Mühle / Chamb
Discharge from 01.11.1974 to 26.04.2024
| Date | Mean value [m³/s] | Maximum [m³/s] | Minimum [m³/s] |
|---|---|---|---|
| 26.04.2024 | 0.446 | 0.459 | 0.439 |
| 25.04.2024 | 0.44 | 0.459 | 0.419 |
| 24.04.2024 | 0.444 | 0.459 | 0.419 |
| 23.04.2024 | 0.505 | 0.567 | 0.459 |
| 22.04.2024 | 0.736 | 1.08 | 0.567 |
| 21.04.2024 | 0.655 | 1.08 | 0.522 |
| 20.04.2024 | 0.888 | 1.19 | 0.613 |
© Bayerisches Landesamt für Umwelt 2024