
- Start >
- Rivers >
- Discharge >
- Naab - Regen >
- Geisleithen >
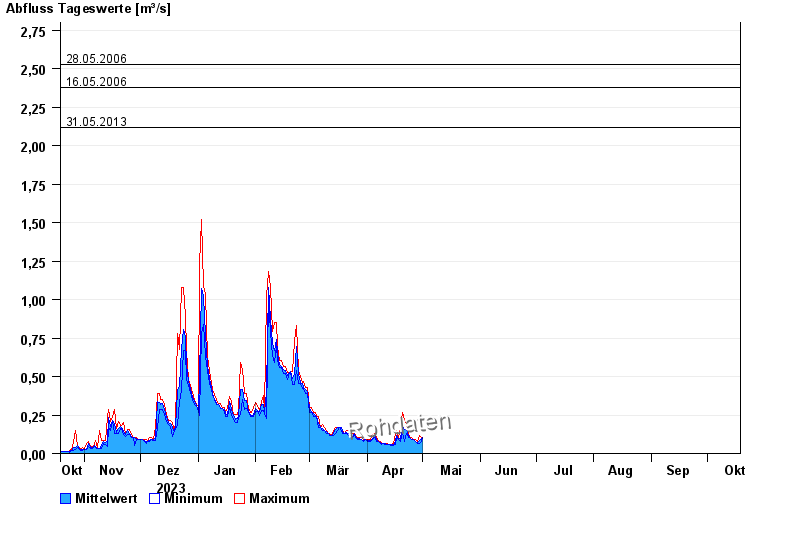
- Chart of year

Chart of year Geisleithen / Geisbach
Discharge from 19.10.2023 to 18.10.2024
- 05.06.2011 Abfluss: 3,78 m³/s
- 14.06.2020 Abfluss: 2,76 m³/s
- 28.05.2006 Abfluss: 2,53 m³/s
- 16.05.2006 Abfluss: 2,38 m³/s
- 31.05.2013 Abfluss: 2,12 m³/s
| Date | Mean value [m³/s] | Maximum [m³/s] | Minimum [m³/s] |
|---|---|---|---|
| 16.05.2024 | 0.047 | 0.047 | 0.04 |
| 15.05.2024 | 0.047 | 0.047 | 0.047 |
| 14.05.2024 | 0.057 | 0.145 | 0.047 |
| 13.05.2024 | 0.062 | 0.064 | 0.055 |
| 12.05.2024 | 0.072 | 0.074 | 0.064 |
| 11.05.2024 | 0.074 | 0.074 | 0.074 |
| 10.05.2024 | 0.083 | 0.085 | 0.074 |
© Bayerisches Landesamt für Umwelt 2024