
- Start >
- Rivers >
- Discharge >
- Naab - Regen >
- Geisleithen >
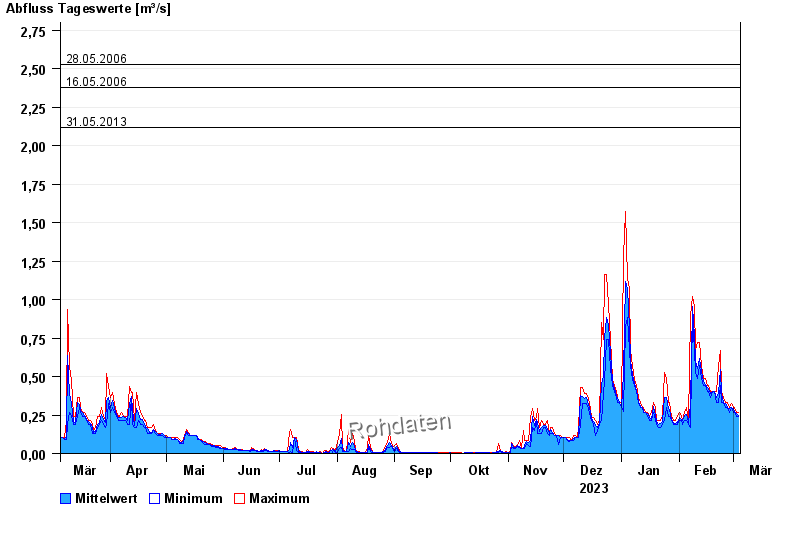
- Chart of year

Chart of year Geisleithen / Geisbach
Discharge from 05.03.2023 to 04.03.2024
- 05.06.2011 Abfluss: 3,78 m³/s
- 14.06.2020 Abfluss: 2,76 m³/s
- 28.05.2006 Abfluss: 2,53 m³/s
- 16.05.2006 Abfluss: 2,38 m³/s
- 31.05.2013 Abfluss: 2,12 m³/s
| Date | Mean value [m³/s] | Maximum [m³/s] | Minimum [m³/s] |
|---|---|---|---|
| 04.03.2024 | 0.25 | 0.266 | 0.239 |
| 03.03.2024 | 0.261 | 0.266 | 0.239 |
| 02.03.2024 | 0.275 | 0.296 | 0.266 |
| 01.03.2024 | 0.293 | 0.296 | 0.266 |
| 29.02.2024 | 0.4 | 0.431 | 0.393 |
| 28.02.2024 | 0.418 | 0.429 | 0.391 |
| 27.02.2024 | 0.427 | 0.465 | 0.425 |
© Bayerisches Landesamt für Umwelt 2024