
- Start >
- Rivers >
- Discharge >
- Naab - Regen >
- Geisleithen >
- Chart of year

Chart of year Geisleithen / Geisbach
Discharge from 01.01.2018 to 31.12.2018
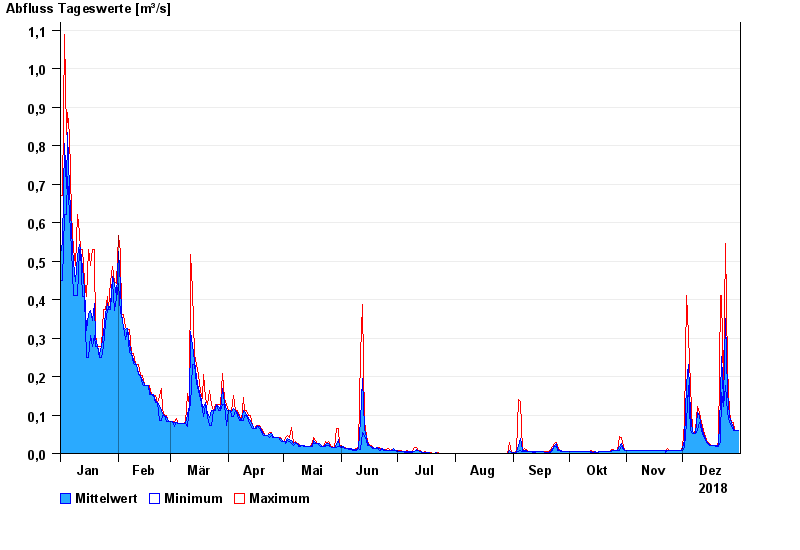
| Date | Mean value [m³/s] | Maximum [m³/s] | Minimum [m³/s] |
|---|---|---|---|
| 31.12.2018 | 0.061 | 0.061 | 0.061 |
| 30.12.2018 | 0.061 | 0.061 | 0.061 |
| 29.12.2018 | 0.061 | 0.061 | 0.061 |
| 28.12.2018 | 0.067 | 0.081 | 0.061 |
| 27.12.2018 | 0.081 | 0.081 | 0.07 |
| 26.12.2018 | 0.097 | 0.107 | 0.081 |
| 25.12.2018 | 0.159 | 0.223 | 0.107 |
© Bayerisches Landesamt für Umwelt 2024