
- Start >
- Rivers >
- Discharge >
- Naab - Regen >
- Geisleithen >
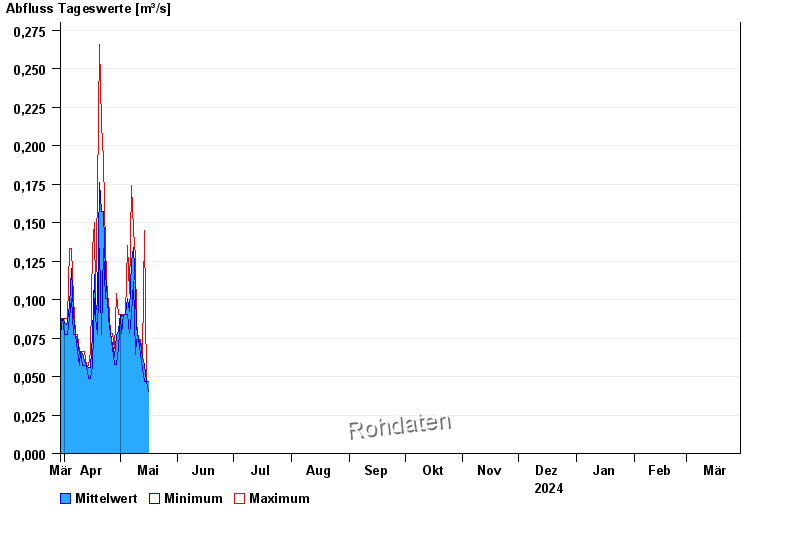
- Chart of year

Chart of year Geisleithen / Geisbach
Discharge from 30.03.2024 to 29.03.2025
- 05.06.2011 Abfluss: 3,78 m³/s
- 14.06.2020 Abfluss: 2,76 m³/s
- 28.05.2006 Abfluss: 2,53 m³/s
- 16.05.2006 Abfluss: 2,38 m³/s
- 31.05.2013 Abfluss: 2,12 m³/s
| Date | Mean value [m³/s] | Maximum [m³/s] | Minimum [m³/s] |
|---|---|---|---|
| 09.06.2024 | 0.128 | 0.128 | 0.128 |
| 08.06.2024 | 0.138 | 0.145 | 0.128 |
| 07.06.2024 | 0.154 | 0.164 | 0.085 |
| 06.06.2024 | 0.155 | 0.164 | 0.145 |
| 05.06.2024 | 0.159 | 0.164 | 0.145 |
| 04.06.2024 | 0.177 | 0.185 | 0.164 |
| 03.06.2024 | 0.201 | 0.232 | 0.185 |
© Bayerisches Landesamt für Umwelt 2024