
- Start >
- Rivers >
- Discharge >
- Naab - Regen >
- Fronhof >
- Chart of year

Chart of year Fronhof / Murach
Discharge from 28.05.2019 to 27.05.2020
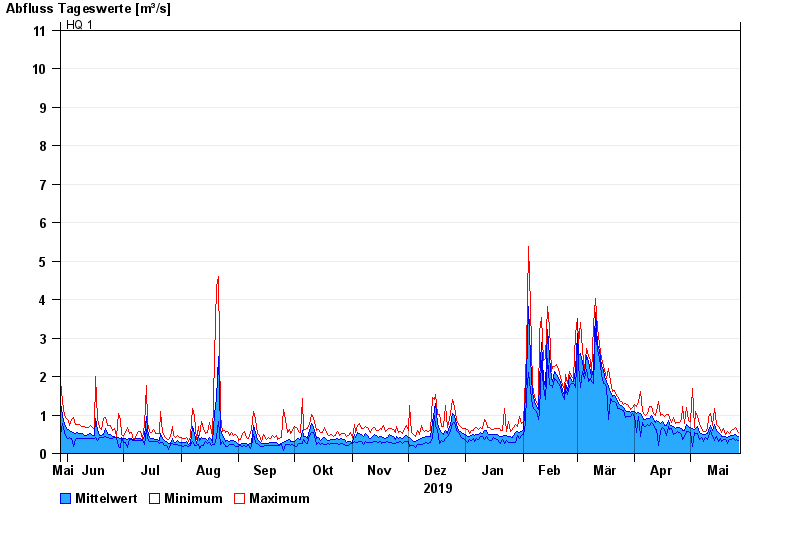
- HQ1 11 m³/s
- HQ2 14 m³/s
- HQ5 18 m³/s
- HQ10 21 m³/s
- HQ20 24 m³/s
- HQ50 28 m³/s
- HQ100 30 m³/s
| Date | Mean value [m³/s] | Maximum [m³/s] | Minimum [m³/s] |
|---|---|---|---|
| 27.05.2020 | 0.434 | 0.533 | 0.342 |
| 26.05.2020 | 0.464 | 0.618 | 0.365 |
| 25.05.2020 | 0.501 | 0.677 | 0.345 |
| 24.05.2020 | 0.462 | 0.622 | 0.389 |
| 23.05.2020 | 0.457 | 0.593 | 0.369 |
| 22.05.2020 | 0.429 | 0.515 | 0.37 |
| 21.05.2020 | 0.427 | 0.571 | 0.27 |
© Bayerisches Landesamt für Umwelt 2024