
- Start >
- Rivers >
- Discharge >
- Naab - Regen >
- Fronhof >
- Chart of year

Chart of year Fronhof / Murach
Discharge from 01.01.2021 to 31.12.2021
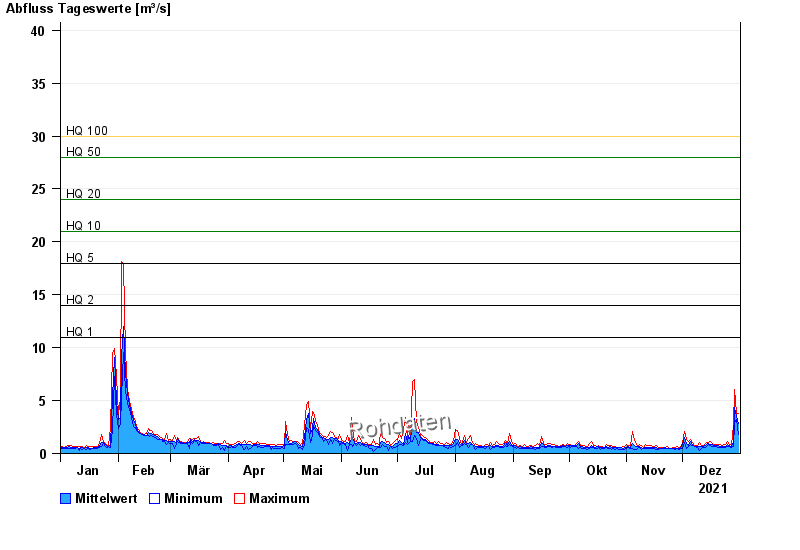
- HQ1 11 m³/s
- HQ2 14 m³/s
- HQ5 18 m³/s
- HQ10 21 m³/s
- HQ20 24 m³/s
- HQ50 28 m³/s
- HQ100 30 m³/s
| Date | Mean value [m³/s] | Maximum [m³/s] | Minimum [m³/s] |
|---|---|---|---|
| 31.12.2021 | 2.85 | 3.82 | 1.83 |
| 30.12.2021 | 3.45 | 3.82 | 3.22 |
| 29.12.2021 | 4.36 | 6.02 | 2.8 |
| 28.12.2021 | 1.05 | 2.65 | 0.622 |
| 27.12.2021 | 0.706 | 0.844 | 0.594 |
| 26.12.2021 | 0.727 | 0.809 | 0.622 |
| 25.12.2021 | 0.805 | 1.1 | 0.622 |
© Bayerisches Landesamt für Umwelt 2024