
- Start >
- Rivers >
- Discharge >
- Naab - Regen >
- Fronhof >
- Chart of year

Chart of year Fronhof / Murach
Discharge from 01.01.2019 to 31.12.2019
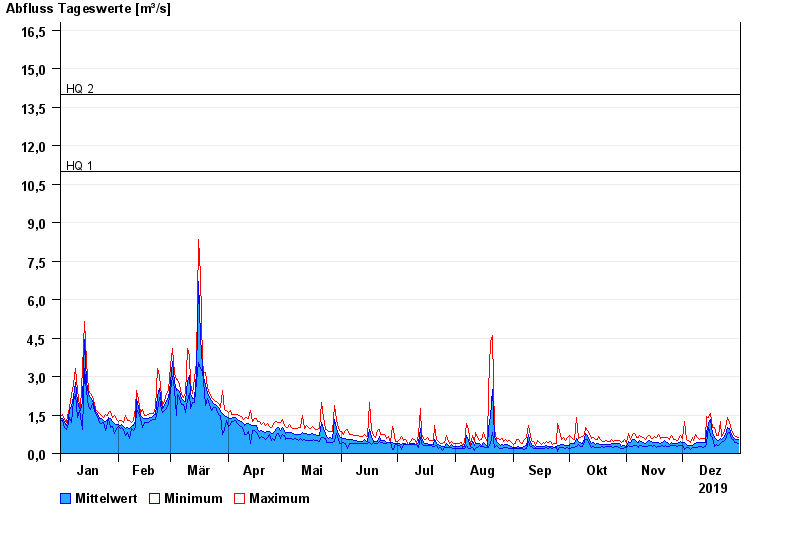
- HQ1 11 m³/s
- HQ2 14 m³/s
- HQ5 18 m³/s
- HQ10 21 m³/s
- HQ20 24 m³/s
- HQ50 28 m³/s
- HQ100 30 m³/s
| Date | Mean value [m³/s] | Maximum [m³/s] | Minimum [m³/s] |
|---|---|---|---|
| 31.12.2019 | 0.528 | 0.637 | 0.402 |
| 30.12.2019 | 0.536 | 0.665 | 0.422 |
| 29.12.2019 | 0.566 | 0.693 | 0.445 |
| 28.12.2019 | 0.609 | 0.752 | 0.545 |
| 27.12.2019 | 0.757 | 0.885 | 0.6 |
| 26.12.2019 | 0.991 | 1.19 | 0.815 |
| 25.12.2019 | 1.03 | 1.4 | 0.778 |
© Bayerisches Landesamt für Umwelt 2024