
- Start >
- Rivers >
- Discharge >
- Naab - Regen >
- Friedersreuth >
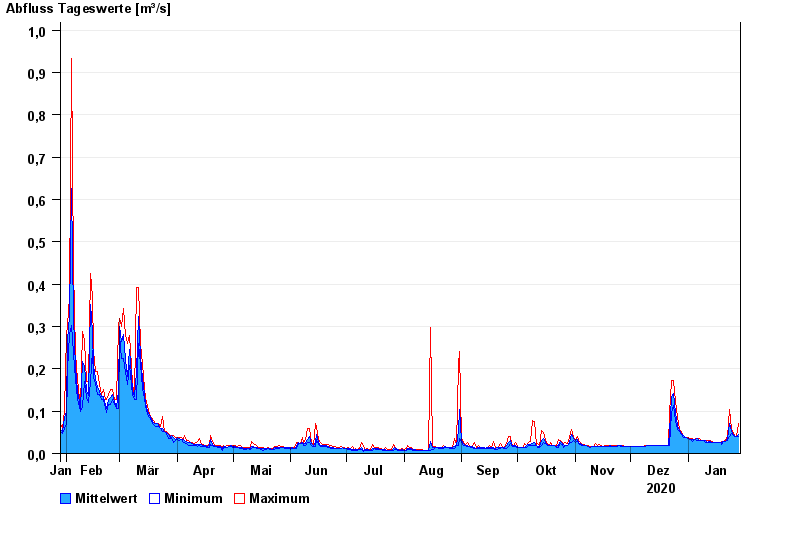
- Chart of year

Chart of year Friedersreuth / Schweinnaab
Discharge from 29.01.2020 to 28.01.2021
- 13.01.2011 Abfluss: 3,29 m³/s
- 23.12.2012 Abfluss: 2,05 m³/s
- 02.06.2013 Abfluss: 2,04 m³/s
- 02.08.2010 Abfluss: 1,64 m³/s
- 30.01.2013 Abfluss: 1,5 m³/s
| Date | Mean value [m³/s] | Maximum [m³/s] | Minimum [m³/s] |
|---|---|---|---|
| 28.01.2021 | 0.044 | 0.07 | 0.039 |
| 27.01.2021 | 0.039 | 0.039 | 0.039 |
| 26.01.2021 | 0.04 | 0.043 | 0.039 |
| 25.01.2021 | 0.044 | 0.048 | 0.043 |
| 24.01.2021 | 0.051 | 0.058 | 0.048 |
| 23.01.2021 | 0.07 | 0.104 | 0.039 |
| 22.01.2021 | 0.035 | 0.039 | 0.031 |
© Bayerisches Landesamt für Umwelt 2024