
- Start >
- Rivers >
- Discharge >
- Naab - Regen >
- Friedersreuth >
- Chart of year

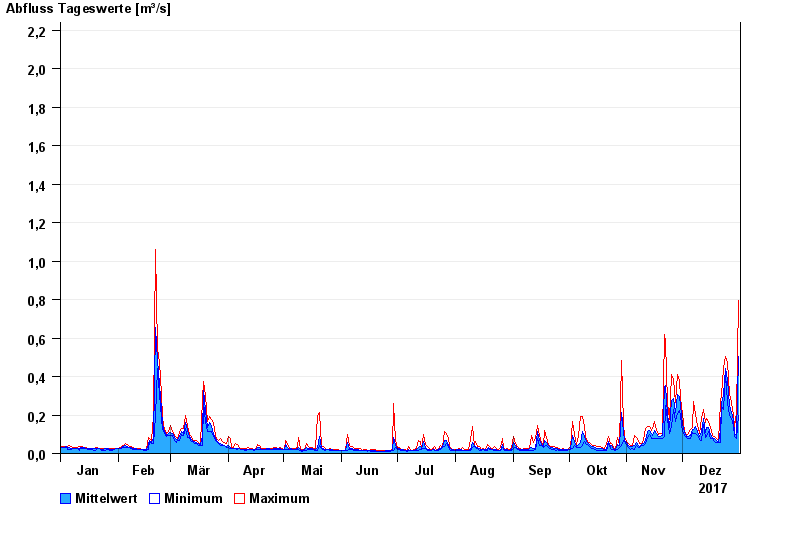
Chart of year Friedersreuth / Schweinnaab
Discharge from 01.01.2017 to 31.12.2017
 Für diesen Pegel sind keine Jährlichkeiten hinterlegt.
| Date | Mean value [m³/s] | Maximum [m³/s] | Minimum [m³/s] |
|---|---|---|---|
| 31.12.2017 | 0.506 | 0.794 | 0.195 |
| 30.12.2017 | 0.099 | 0.212 | 0.079 |
| 29.12.2017 | 0.104 | 0.139 | 0.087 |
| 28.12.2017 | 0.172 | 0.195 | 0.139 |
| 27.12.2017 | 0.211 | 0.266 | 0.18 |
| 26.12.2017 | 0.25 | 0.309 | 0.195 |
| 25.12.2017 | 0.382 | 0.473 | 0.266 |
© Bayerisches Landesamt für Umwelt 2024