
- Start >
- Rivers >
- Discharge >
- Naab - Regen >
- Friedersreuth >
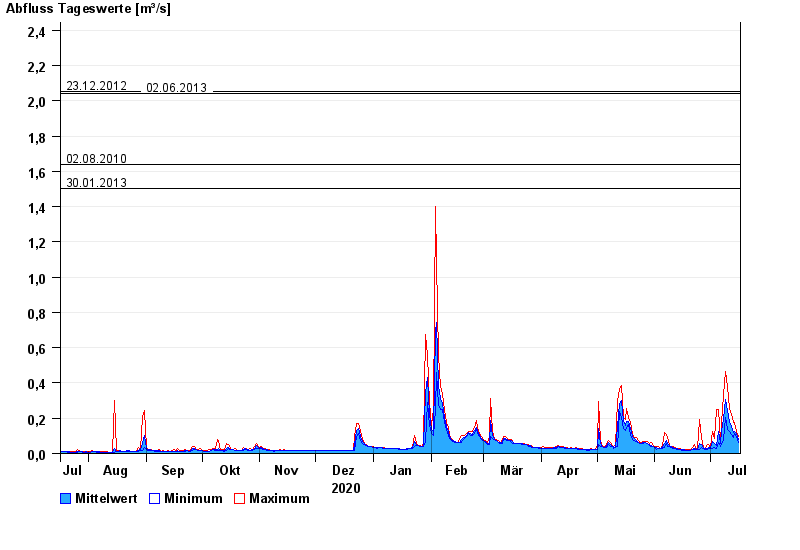
- Chart of year

Chart of year Friedersreuth / Schweinnaab
Discharge from 17.07.2020 to 16.07.2021
- 13.01.2011 Abfluss: 3,29 m³/s
- 23.12.2012 Abfluss: 2,05 m³/s
- 02.06.2013 Abfluss: 2,04 m³/s
- 02.08.2010 Abfluss: 1,64 m³/s
- 30.01.2013 Abfluss: 1,5 m³/s
| Date | Mean value [m³/s] | Maximum [m³/s] | Minimum [m³/s] |
|---|---|---|---|
| 16.07.2021 | 0.08 | 0.096 | 0.065 |
| 15.07.2021 | 0.113 | 0.127 | 0.096 |
| 14.07.2021 | 0.126 | 0.177 | 0.111 |
| 13.07.2021 | 0.117 | 0.177 | 0.089 |
| 12.07.2021 | 0.155 | 0.221 | 0.107 |
| 11.07.2021 | 0.177 | 0.256 | 0.126 |
| 10.07.2021 | 0.241 | 0.382 | 0.137 |
© Bayerisches Landesamt für Umwelt 2024