
- Start >
- Rivers >
- Discharge >
- Naab - Regen >
- Friedersreuth >
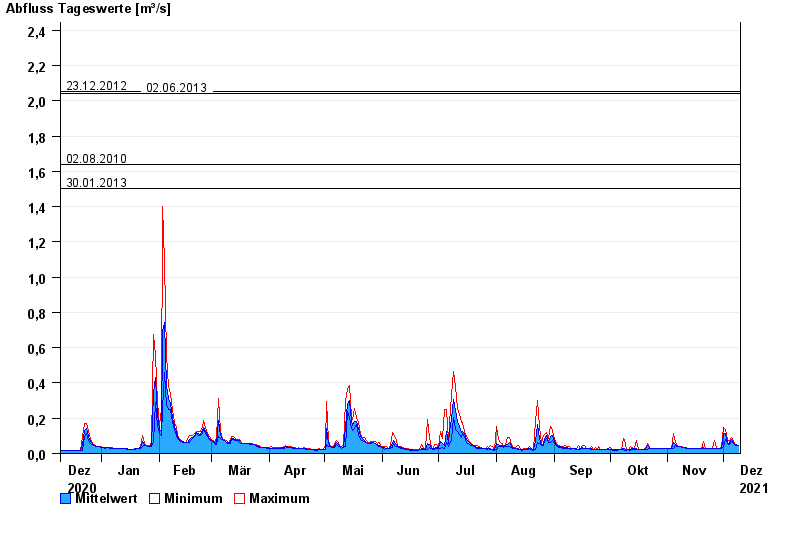
- Chart of year

Chart of year Friedersreuth / Schweinnaab
Discharge from 10.12.2020 to 09.12.2021
- 13.01.2011 Abfluss: 3,29 m³/s
- 23.12.2012 Abfluss: 2,05 m³/s
- 02.06.2013 Abfluss: 2,04 m³/s
- 02.08.2010 Abfluss: 1,64 m³/s
- 30.01.2013 Abfluss: 1,5 m³/s
| Date | Mean value [m³/s] | Maximum [m³/s] | Minimum [m³/s] |
|---|---|---|---|
| 09.12.2021 | 0.047 | 0.047 | 0.047 |
| 08.12.2021 | 0.051 | 0.051 | 0.047 |
| 07.12.2021 | 0.053 | 0.056 | 0.051 |
| 06.12.2021 | 0.061 | 0.074 | 0.056 |
| 05.12.2021 | 0.082 | 0.088 | 0.067 |
| 04.12.2021 | 0.055 | 0.067 | 0.051 |
| 03.12.2021 | 0.064 | 0.08 | 0.056 |
© Bayerisches Landesamt für Umwelt 2024