
- Start >
- Rivers >
- Discharge >
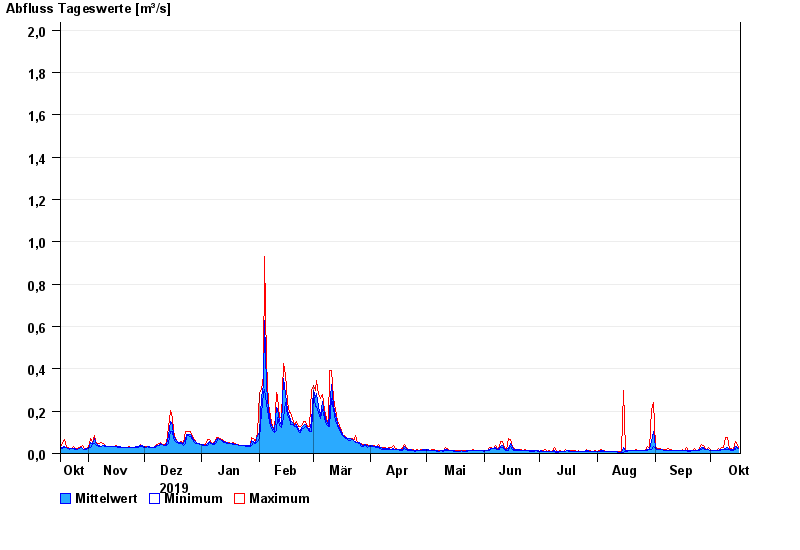
- Naab - Regen >
- Friedersreuth >
- Chart of year

Chart of year Friedersreuth / Schweinnaab
Discharge from 17.10.2019 to 16.10.2020
 Für diesen Pegel sind keine Jährlichkeiten hinterlegt.
| Date | Mean value [m³/s] | Maximum [m³/s] | Minimum [m³/s] |
|---|---|---|---|
| 16.10.2020 | 0.025 | 0.03 | 0.023 |
| 15.10.2020 | 0.035 | 0.05 | 0.026 |
| 14.10.2020 | 0.031 | 0.055 | 0.018 |
| 13.10.2020 | 0.017 | 0.02 | 0.013 |
| 12.10.2020 | 0.017 | 0.023 | 0.015 |
| 11.10.2020 | 0.018 | 0.018 | 0.018 |
| 10.10.2020 | 0.027 | 0.075 | 0.018 |
© Bayerisches Landesamt für Umwelt 2024