
- Start >
- Rivers >
- Discharge >
- Naab - Regen >
- Eschlkam >
- Chart of year

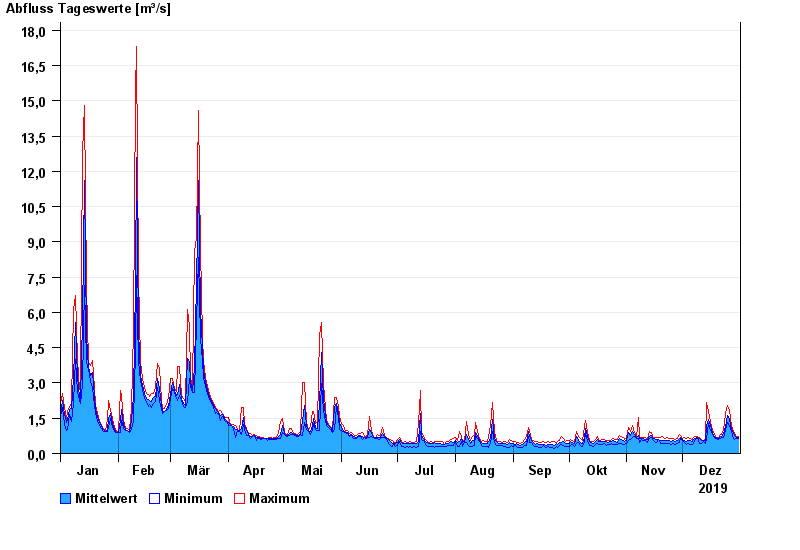
Chart of year Eschlkam / Chamb
Discharge from 01.01.2019 to 31.12.2019
| Date | Mean value [m³/s] | Maximum [m³/s] | Minimum [m³/s] |
|---|---|---|---|
| 31.12.2019 | 0.673 | 0.735 | 0.642 |
| 30.12.2019 | 0.682 | 0.736 | 0.642 |
| 29.12.2019 | 0.755 | 0.834 | 0.598 |
| 28.12.2019 | 0.849 | 0.934 | 0.645 |
| 27.12.2019 | 1.03 | 1.19 | 0.934 |
| 26.12.2019 | 1.44 | 1.81 | 1.19 |
| 25.12.2019 | 1.6 | 2.06 | 1.3 |
© Bayerisches Landesamt für Umwelt 2024