
- Start >
- Rivers >
- Discharge >
- Naab - Regen >
- Eschlkam >
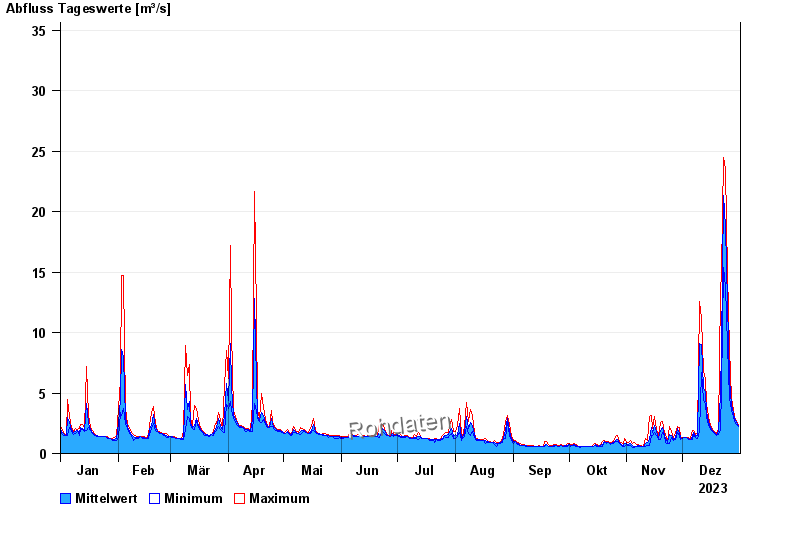
- Chart of year

Chart of year Eschlkam / Chamb
Discharge from 01.01.2023 to 31.12.2023
- 17.05.2013 Abfluss: 52 m³/s
- 03.06.2013 Abfluss: 43,1 m³/s
- 03.06.2010 Abfluss: 40,3 m³/s
- 10.06.2013 Abfluss: 38,8 m³/s
- 15.08.2011 Abfluss: 36,2 m³/s
| Date | Mean value [m³/s] | Maximum [m³/s] | Minimum [m³/s] |
|---|---|---|---|
| 31.12.2023 | 2.33 | 2.41 | 2.27 |
| 30.12.2023 | 2.55 | 2.68 | 2.41 |
| 29.12.2023 | 2.89 | 3.1 | 2.68 |
| 28.12.2023 | 3.27 | 3.57 | 3.05 |
| 27.12.2023 | 4 | 4.53 | 3.57 |
| 26.12.2023 | 6.09 | 8.65 | 4.53 |
| 25.12.2023 | 12.5 | 14.9 | 8.83 |
© Bayerisches Landesamt für Umwelt 2024