
- Start >
- Rivers >
- Discharge >
- Naab - Regen >
- Donauwörth >
- Chart of year

Chart of year Donauwörth / Donau
Discharge from 20.07.2021 to 19.07.2022
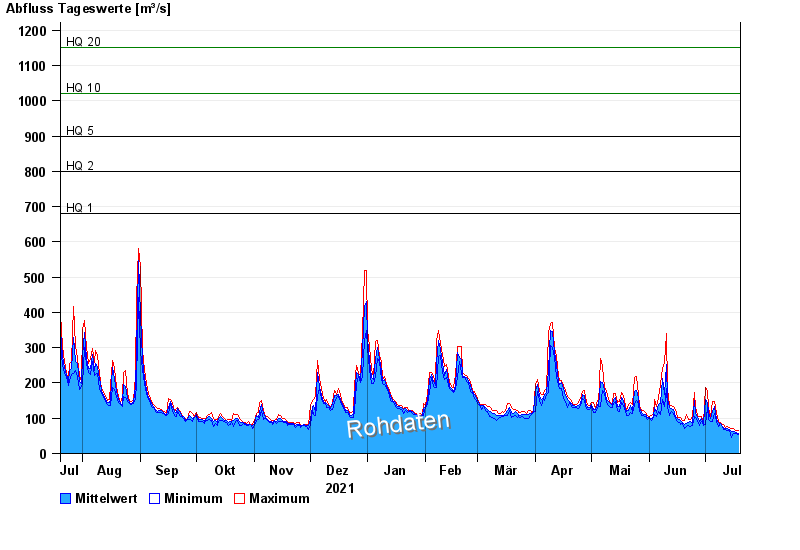
- HQ1 680 m³/s
- HQ2 800 m³/s
- HQ5 900 m³/s
- HQ10 1020 m³/s
- HQ20 1150 m³/s
- HQ50 1300 m³/s
- HQ100 1450 m³/s
| Date | Mean value [m³/s] | Maximum [m³/s] | Minimum [m³/s] |
|---|---|---|---|
| 19.07.2022 | 55.8 | 66.4 | 52.6 |
| 18.07.2022 | 60.8 | 64.2 | 55.8 |
| 17.07.2022 | 62.8 | 67.4 | 57.9 |
| 16.07.2022 | 62.2 | 69.6 | 56.8 |
| 15.07.2022 | 61.9 | 70.6 | 46.3 |
| 14.07.2022 | 67.7 | 72.8 | 65.2 |
| 13.07.2022 | 71.9 | 77.2 | 65.2 |
© Bayerisches Landesamt für Umwelt 2024