
- Start >
- Rivers >
- Discharge >
- Naab - Regen >
- Donauwörth >
- Chart of year

Chart of year Donauwörth / Donau
Discharge from 29.01.2020 to 28.01.2021
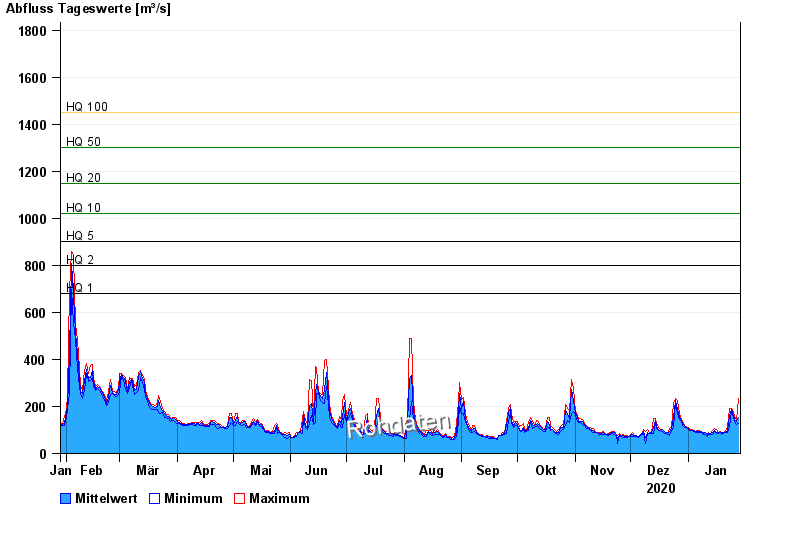
- HQ1 680 m³/s
- HQ2 800 m³/s
- HQ5 900 m³/s
- HQ10 1020 m³/s
- HQ20 1150 m³/s
- HQ50 1300 m³/s
- HQ100 1450 m³/s
| Date | Mean value [m³/s] | Maximum [m³/s] | Minimum [m³/s] |
|---|---|---|---|
| 28.01.2021 | 151 | 234 | 127 |
| 27.01.2021 | 134 | 139 | 124 |
| 26.01.2021 | 146 | 156 | 134 |
| 25.01.2021 | 163 | 177 | 154 |
| 24.01.2021 | 185 | 192 | 177 |
| 23.01.2021 | 163 | 192 | 114 |
| 22.01.2021 | 98.4 | 114 | 89.8 |
© Bayerisches Landesamt für Umwelt 2024