
- Start >
- Rivers >
- Discharge >
- Naab - Regen >
- Donauwörth >
- Chart of year

Chart of year Donauwörth / Donau
Discharge from 22.01.2021 to 21.01.2022
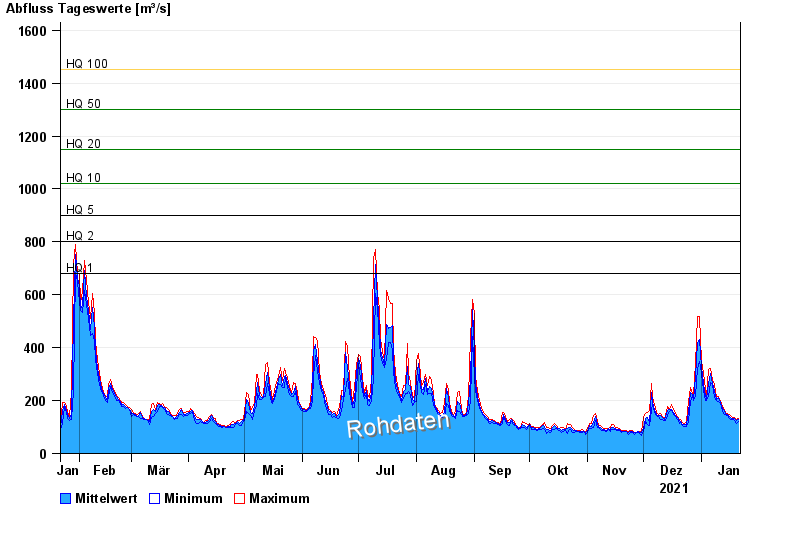
- HQ1 680 m³/s
- HQ2 800 m³/s
- HQ5 900 m³/s
- HQ10 1020 m³/s
- HQ20 1150 m³/s
- HQ50 1300 m³/s
- HQ100 1450 m³/s
| Date | Mean value [m³/s] | Maximum [m³/s] | Minimum [m³/s] |
|---|---|---|---|
| 21.01.2022 | 128 | 131 | 122 |
| 20.01.2022 | 126 | 127 | 114 |
| 19.01.2022 | 131 | 135 | 125 |
| 18.01.2022 | 133 | 137 | 127 |
| 17.01.2022 | 134 | 139 | 127 |
| 16.01.2022 | 141 | 147 | 134 |
| 15.01.2022 | 146 | 150 | 143 |
© Bayerisches Landesamt für Umwelt 2024