
- Start >
- Rivers >
- Discharge >
- Naab - Regen >
- Donauwörth >
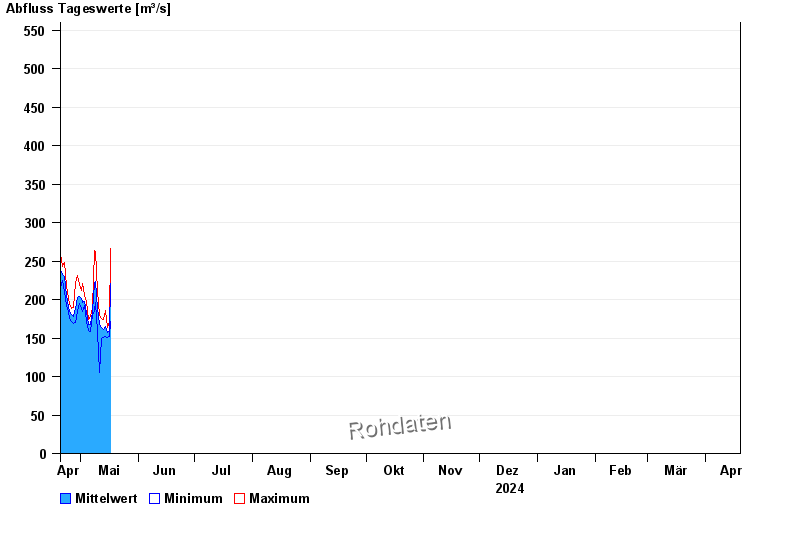
- Chart of year

Chart of year Donauwörth / Donau
Discharge from 20.04.2024 to 19.04.2025
- HQ1 680 m³/s
- HQ2 800 m³/s
- HQ5 900 m³/s
- HQ10 1020 m³/s
- HQ20 1150 m³/s
- HQ50 1300 m³/s
- HQ100 1450 m³/s
| Date | Mean value [m³/s] | Maximum [m³/s] | Minimum [m³/s] |
|---|---|---|---|
| 15.05.2024 | 156 | 164 | 151 |
| 14.05.2024 | 165 | 186 | 152 |
| 13.05.2024 | 161 | 174 | 151 |
| 12.05.2024 | 164 | 176 | 149 |
| 11.05.2024 | 168 | 179 | 105 |
| 10.05.2024 | 188 | 212 | 158 |
| 09.05.2024 | 223 | 263 | 196 |
© Bayerisches Landesamt für Umwelt 2024