
- Start >
- Rivers >
- Discharge >
- Naab - Regen >
- Donauwörth >
- Chart of year

Chart of year Donauwörth / Donau
Discharge from 11.12.2020 to 10.12.2021
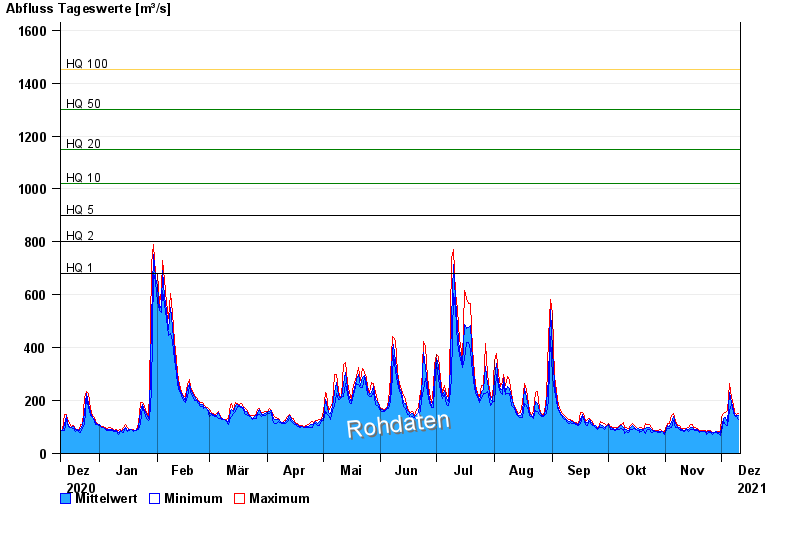
- HQ1 680 m³/s
- HQ2 800 m³/s
- HQ5 900 m³/s
- HQ10 1020 m³/s
- HQ20 1150 m³/s
- HQ50 1300 m³/s
- HQ100 1450 m³/s
| Date | Mean value [m³/s] | Maximum [m³/s] | Minimum [m³/s] |
|---|---|---|---|
| 10.12.2021 | 143 | 152 | 130 |
| 09.12.2021 | 145 | 148 | 141 |
| 08.12.2021 | 148 | 155 | 143 |
| 07.12.2021 | 164 | 185 | 155 |
| 06.12.2021 | 191 | 213 | 185 |
| 05.12.2021 | 229 | 263 | 163 |
| 04.12.2021 | 118 | 162 | 107 |
© Bayerisches Landesamt für Umwelt 2024