
- Start >
- Rivers >
- Discharge >
- Naab - Regen >
- Donauwörth >
- Chart of year

Chart of year Donauwörth / Donau
Discharge from 01.01.2024 to 31.12.2024
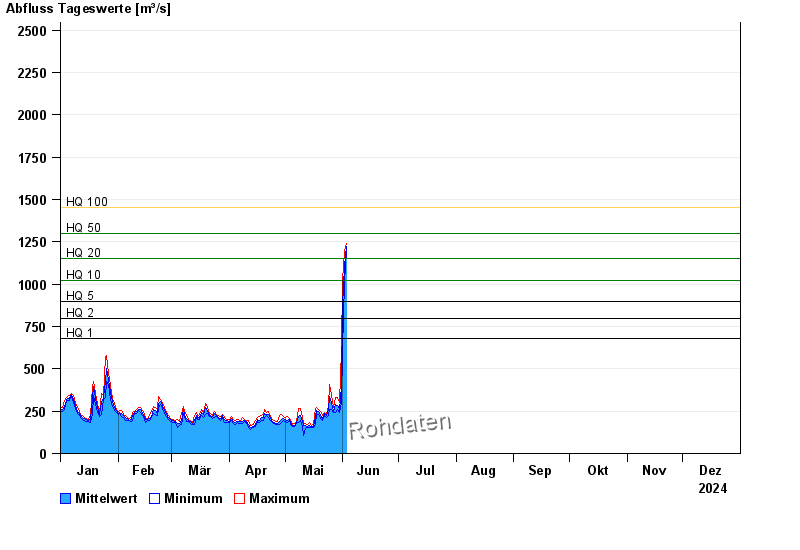
- HQ1 680 m³/s
- HQ2 800 m³/s
- HQ5 900 m³/s
- HQ10 1020 m³/s
- HQ20 1150 m³/s
- HQ50 1300 m³/s
- HQ100 1450 m³/s
| Date | Mean value [m³/s] | Maximum [m³/s] | Minimum [m³/s] |
|---|---|---|---|
| 29.05.2024 | 314 | 329 | 284 |
| 28.05.2024 | 289 | 329 | 245 |
| 27.05.2024 | 250 | 269 | 242 |
| 26.05.2024 | 304 | 350 | 261 |
| 25.05.2024 | 336 | 409 | 257 |
| 24.05.2024 | 257 | 281 | 226 |
| 23.05.2024 | 222 | 228 | 215 |
© Bayerisches Landesamt für Umwelt 2024