
- Start >
- Rivers >
- Discharge >
- Naab - Regen >
- Böhmischbruck >
- Chart of year

Chart of year Böhmischbruck / Pfreimd
Discharge from 24.01.2023 to 23.01.2024
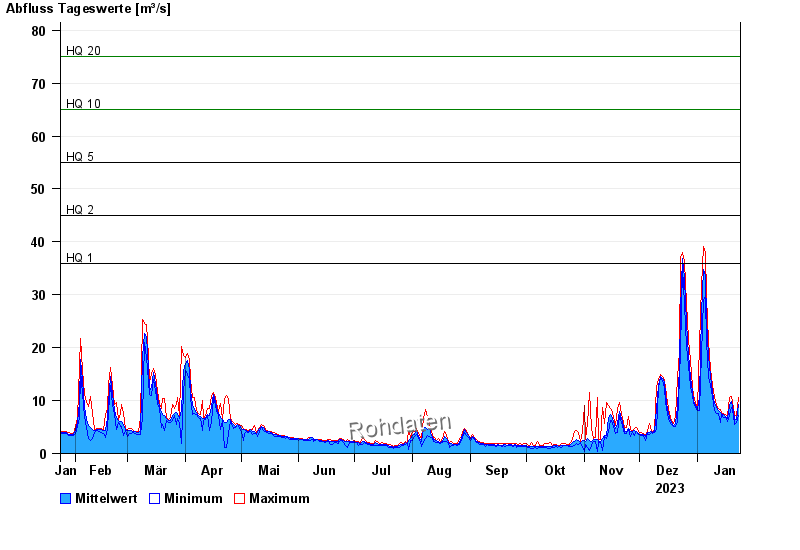
- HQ1 36 m³/s
- HQ2 45 m³/s
- HQ5 55 m³/s
- HQ10 65 m³/s
- HQ20 75 m³/s
- HQ50 90 m³/s
- HQ100 100 m³/s
| Date | Mean value [m³/s] | Maximum [m³/s] | Minimum [m³/s] |
|---|---|---|---|
| 23.01.2024 | 9.22 | 10.5 | 7.18 |
| 22.01.2024 | 6.39 | 7.18 | 5.9 |
| 21.01.2024 | 6.44 | 7.18 | 5.48 |
| 20.01.2024 | 7.89 | 8.74 | 7.18 |
| 19.01.2024 | 9.74 | 10.7 | 8.74 |
| 18.01.2024 | 9.05 | 10.5 | 7.18 |
| 17.01.2024 | 6.69 | 7.18 | 6.11 |
© Bayerisches Landesamt für Umwelt 2024