
- Start >
- Rivers >
- Discharge >
- Naab - Regen >
- Böhmischbruck >
- Chart of year

Chart of year Böhmischbruck / Pfreimd
Discharge from 01.01.2018 to 31.12.2018
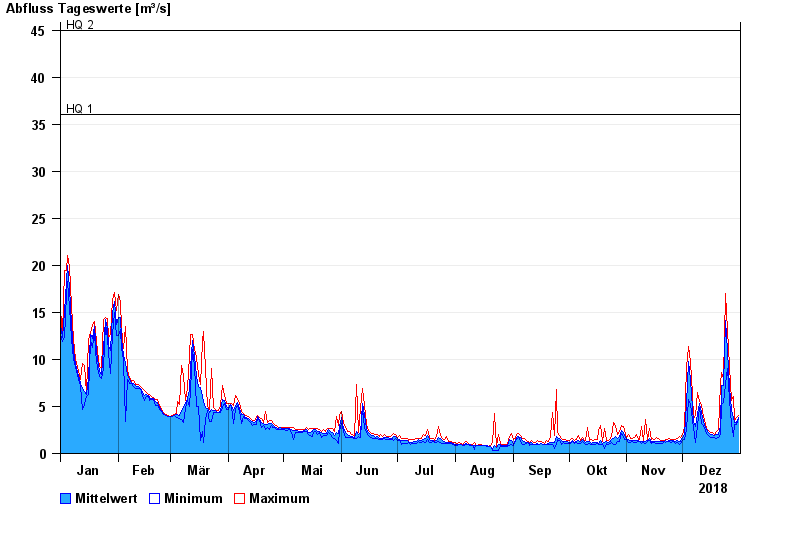
- HQ1 36 m³/s
- HQ2 45 m³/s
- HQ5 55 m³/s
- HQ10 65 m³/s
- HQ20 75 m³/s
- HQ50 90 m³/s
- HQ100 100 m³/s
| Date | Mean value [m³/s] | Maximum [m³/s] | Minimum [m³/s] |
|---|---|---|---|
| 31.12.2018 | 3.84 | 4.05 | 3.67 |
| 30.12.2018 | 3.32 | 3.86 | 3.11 |
| 29.12.2018 | 3.25 | 3.47 | 3.1 |
| 28.12.2018 | 3.71 | 6.05 | 1.8 |
| 27.12.2018 | 4.64 | 5.62 | 3.09 |
| 26.12.2018 | 7.03 | 9.28 | 5.62 |
| 25.12.2018 | 11 | 13.1 | 9.06 |
© Bayerisches Landesamt für Umwelt 2024