
- Start >
- Rivers >
- Discharge >
- Naab - Regen >
- Böhmischbruck >
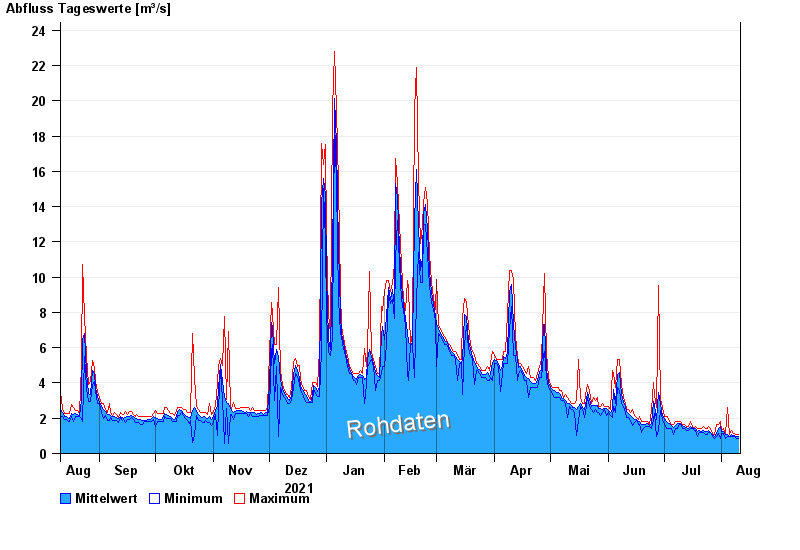
- Chart of year

Chart of year Böhmischbruck / Pfreimd
Discharge from 11.08.2021 to 10.08.2022
| Date | Mean value [m³/s] | Maximum [m³/s] | Minimum [m³/s] |
|---|---|---|---|
| 10.08.2022 | 0.95 | 1.05 | 0.852 |
| 09.08.2022 | 0.958 | 1.05 | 0.852 |
| 08.08.2022 | 1.04 | 1.16 | 0.947 |
| 07.08.2022 | 1.01 | 1.16 | 0.947 |
| 06.08.2022 | 1.09 | 1.28 | 0.947 |
| 05.08.2022 | 0.96 | 1.05 | 0.947 |
| 04.08.2022 | 1.07 | 2.59 | 0.947 |
© Bayerisches Landesamt für Umwelt 2024