
- Start >
- Rivers >
- Discharge >
- Naab - Regen >
- Böhmischbruck >
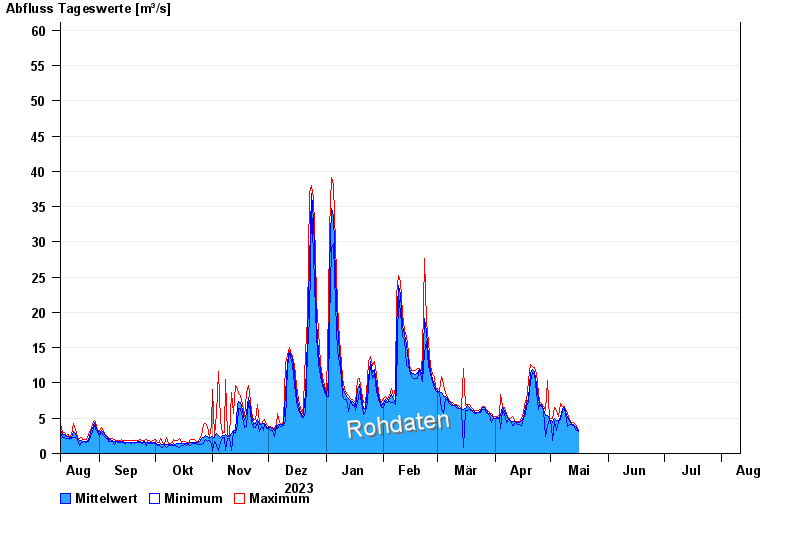
- Chart of year

Chart of year Böhmischbruck / Pfreimd
Discharge from 11.08.2023 to 10.08.2024
- 10.07.1954 Abfluss: 92,3 m³/s
- 01.12.1947 Abfluss: 90 m³/s
- 03.03.1956 Abfluss: 89,4 m³/s
- 03.01.2003 Abfluss: 74,6 m³/s
- 12.01.1936 Abfluss: 73,6 m³/s
| Date | Mean value [m³/s] | Maximum [m³/s] | Minimum [m³/s] |
|---|---|---|---|
| 24.05.2024 | 13.2 | 14 | 12.9 |
| 23.05.2024 | 13.9 | 17 | 12.4 |
| 22.05.2024 | 12.4 | 20.3 | 5.4 |
| 21.05.2024 | 4.48 | 5.4 | 3.42 |
| 20.05.2024 | 5.24 | 5.6 | 4.78 |
| 19.05.2024 | 5.39 | 6.24 | 4.99 |
| 18.05.2024 | 4.53 | 5.19 | 3.8 |
© Bayerisches Landesamt für Umwelt 2024