
- Start >
- Rivers >
- Discharge >
- Naab - Regen >
- Böhmischbruck >
- Chart of year

Chart of year Böhmischbruck / Pfreimd
Discharge from 05.03.2020 to 04.03.2021
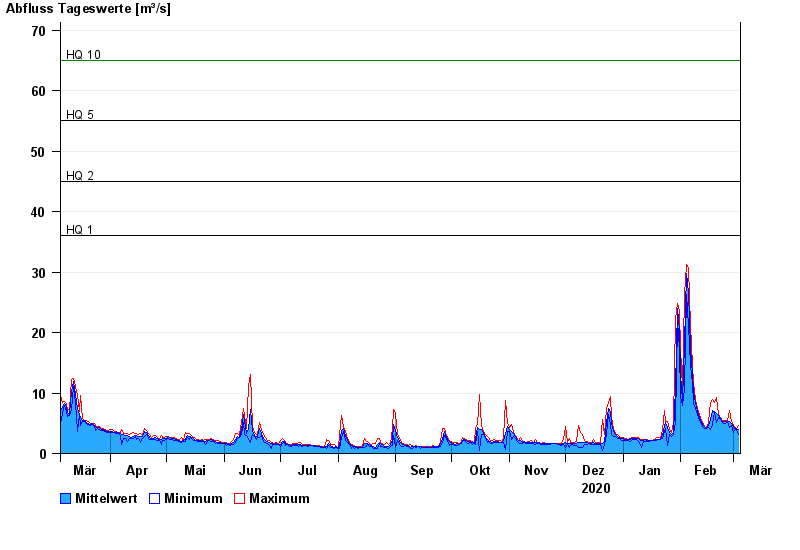
- HQ1 36 m³/s
- HQ2 45 m³/s
- HQ5 55 m³/s
- HQ10 65 m³/s
- HQ20 75 m³/s
- HQ50 90 m³/s
- HQ100 100 m³/s
| Date | Mean value [m³/s] | Maximum [m³/s] | Minimum [m³/s] |
|---|---|---|---|
| 04.03.2021 | 4.05 | 4.59 | 3.07 |
| 03.03.2021 | 4.12 | 4.2 | 4.01 |
| 02.03.2021 | 4.19 | 4.41 | 3.82 |
| 01.03.2021 | 4.45 | 4.61 | 3.45 |
| 28.02.2021 | 4.88 | 5.22 | 4.61 |
| 27.02.2021 | 5.23 | 7.12 | 4.22 |
| 26.02.2021 | 5.28 | 5.44 | 5.23 |
© Bayerisches Landesamt für Umwelt 2024