
- Start >
- Rivers >
- Discharge >
- Naab - Regen >
- Bayreuth >
- Chart of year

Chart of year Bayreuth / Roter Main
Discharge from 23.01.2020 to 22.01.2021
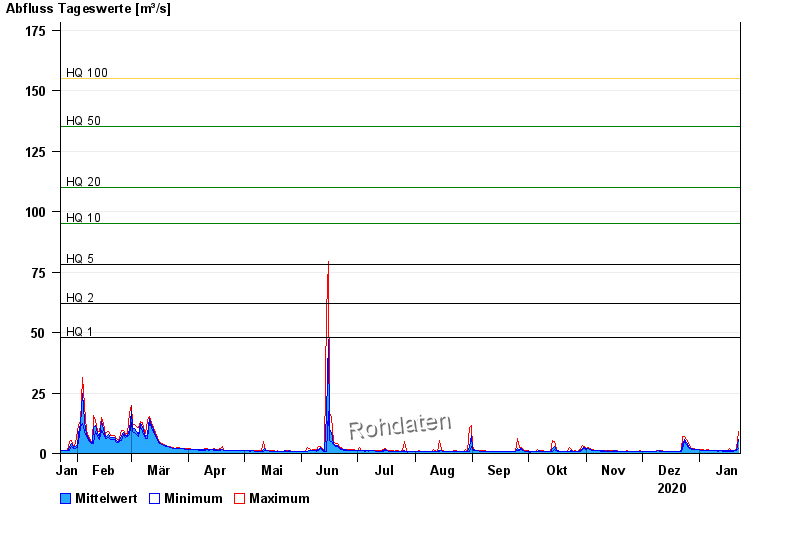
- HQ1 48 m³/s
- HQ2 62 m³/s
- HQ5 78 m³/s
- HQ10 95 m³/s
- HQ20 110 m³/s
- HQ50 135 m³/s
- HQ100 155 m³/s
| Date | Mean value [m³/s] | Maximum [m³/s] | Minimum [m³/s] |
|---|---|---|---|
| 22.01.2021 | 5.98 | 8.93 | 2.17 |
| 21.01.2021 | 1.38 | 2.17 | 1.13 |
| 20.01.2021 | 1.23 | 1.35 | 1.13 |
| 19.01.2021 | 1.1 | 1.35 | 1.03 |
| 18.01.2021 | 1.04 | 1.13 | 1.03 |
| 17.01.2021 | 1.35 | 1.87 | 1.03 |
| 16.01.2021 | 1.13 | 1.35 | 1.03 |
© Bayerisches Landesamt für Umwelt 2024