
- Start >
- Rivers >
- Discharge >
- Naab - Regen >
- Bayreuth >
- Chart of year

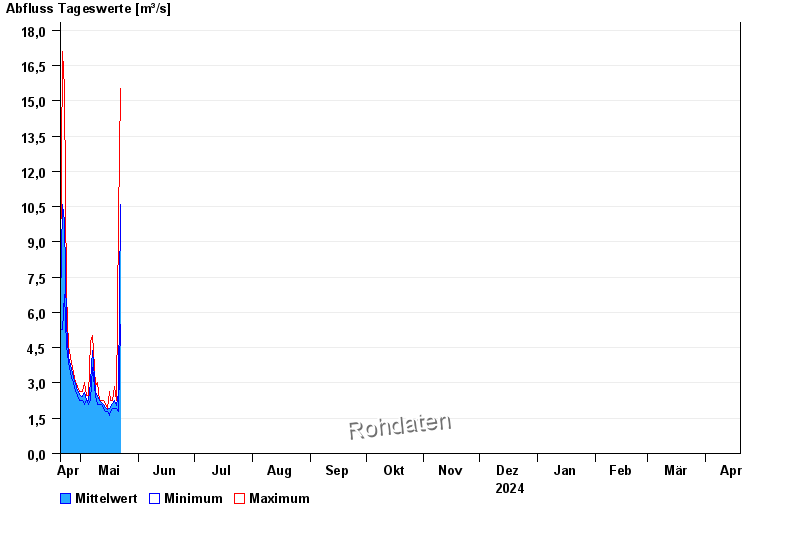
Chart of year Bayreuth / Roter Main
Discharge from 20.04.2024 to 19.04.2025
| Date | Mean value [m³/s] | Maximum [m³/s] | Minimum [m³/s] |
|---|---|---|---|
| 02.05.2024 | 2.46 | 2.46 | 2.46 |
| 01.05.2024 | 2.43 | 2.64 | 2.27 |
| 30.04.2024 | 2.51 | 2.64 | 2.27 |
| 29.04.2024 | 2.67 | 2.84 | 2.46 |
| 28.04.2024 | 2.96 | 3.03 | 2.64 |
| 27.04.2024 | 3.23 | 3.44 | 3.03 |
| 26.04.2024 | 3.59 | 3.87 | 3.24 |
© Bayerisches Landesamt für Umwelt 2024