
- Start >
- Rivers >
- Discharge >
- Naab - Regen >
- Bayreuth >
- Chart of year

Chart of year Bayreuth / Roter Main
Discharge from 01.01.2023 to 31.12.2023
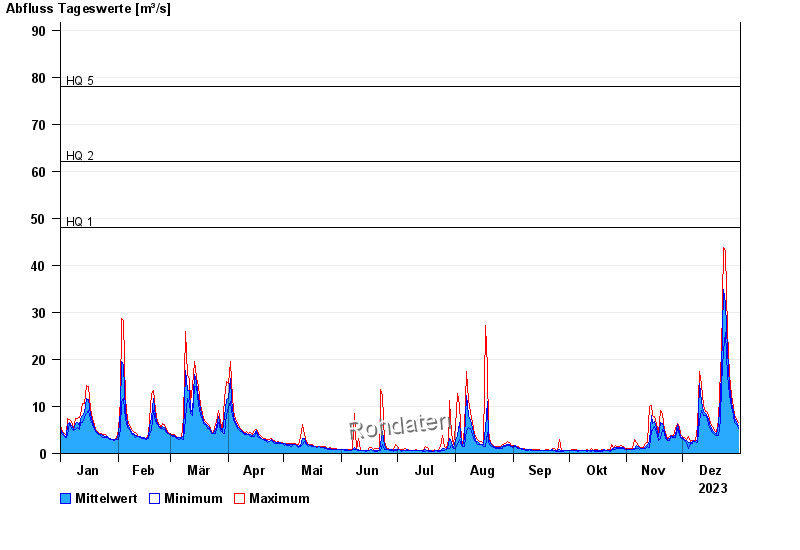
- HQ1 48 m³/s
- HQ2 62 m³/s
- HQ5 78 m³/s
- HQ10 95 m³/s
- HQ20 110 m³/s
- HQ50 135 m³/s
- HQ100 155 m³/s
| Date | Mean value [m³/s] | Maximum [m³/s] | Minimum [m³/s] |
|---|---|---|---|
| 31.12.2023 | 6 | 6.69 | 5.42 |
| 30.12.2023 | 6.67 | 7.23 | 6.17 |
| 29.12.2023 | 7.55 | 8.32 | 6.69 |
| 28.12.2023 | 8.93 | 9.81 | 8.04 |
| 27.12.2023 | 10.9 | 12.4 | 9.81 |
| 26.12.2023 | 14.3 | 16.6 | 12.4 |
| 25.12.2023 | 21.8 | 26.2 | 16.6 |
© Bayerisches Landesamt für Umwelt 2024