
- Start >
- Rivers >
- Discharge >
- Naab - Regen >
- Amberg >
- Chart of year

Chart of year Amberg / Vils
Discharge from 17.05.2022 to 16.05.2023
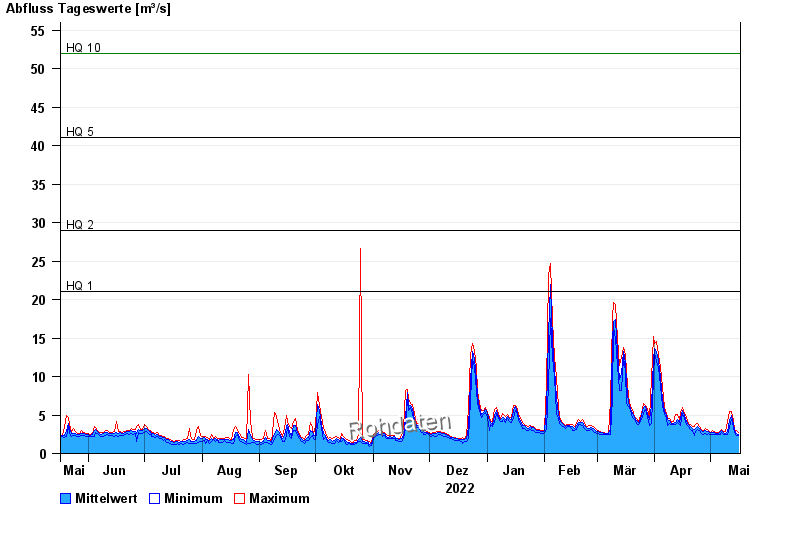
- HQ1 21 m³/s
- HQ2 29 m³/s
- HQ5 41 m³/s
- HQ10 52 m³/s
- HQ20 62 m³/s
- HQ50 80 m³/s
- HQ100 93 m³/s
| Date | Mean value [m³/s] | Maximum [m³/s] | Minimum [m³/s] |
|---|---|---|---|
| 16.05.2023 | 2.53 | 2.76 | 2.28 |
| 15.05.2023 | 2.65 | 3.03 | 2.4 |
| 14.05.2023 | 3.05 | 3.18 | 2.79 |
| 13.05.2023 | 3.83 | 4.23 | 3.33 |
| 12.05.2023 | 4.99 | 5.44 | 4.43 |
| 11.05.2023 | 4.28 | 5.44 | 3.36 |
| 10.05.2023 | 2.92 | 4.11 | 2.45 |
© Bayerisches Landesamt für Umwelt 2024