
- Start >
- Rivers >
- Discharge >
- Naab - Regen >
- Amberg >
- Chart of year

Chart of year Amberg / Vils
Discharge from 01.01.2021 to 31.12.2021
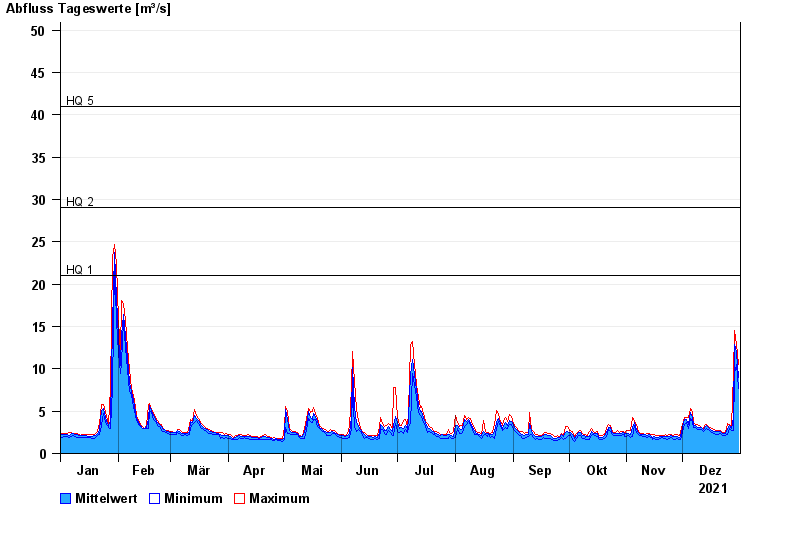
- HQ1 21 m³/s
- HQ2 29 m³/s
- HQ5 41 m³/s
- HQ10 52 m³/s
- HQ20 62 m³/s
- HQ50 80 m³/s
- HQ100 93 m³/s
| Date | Mean value [m³/s] | Maximum [m³/s] | Minimum [m³/s] |
|---|---|---|---|
| 31.12.2021 | 8.92 | 10.5 | 7.62 |
| 30.12.2021 | 11.9 | 12.9 | 10.5 |
| 29.12.2021 | 12.9 | 14.5 | 9.42 |
| 28.12.2021 | 4.31 | 9.42 | 2.76 |
| 27.12.2021 | 2.95 | 3.17 | 2.75 |
| 26.12.2021 | 3.29 | 3.44 | 3.01 |
| 25.12.2021 | 2.97 | 3.59 | 2.23 |
© Bayerisches Landesamt für Umwelt 2024