
- Start >
- Rivers >
- Discharge >
- Naab - Regen >
- Amberg >
- Chart of year

Chart of year Amberg / Vils
Discharge from 01.01.2023 to 31.12.2023
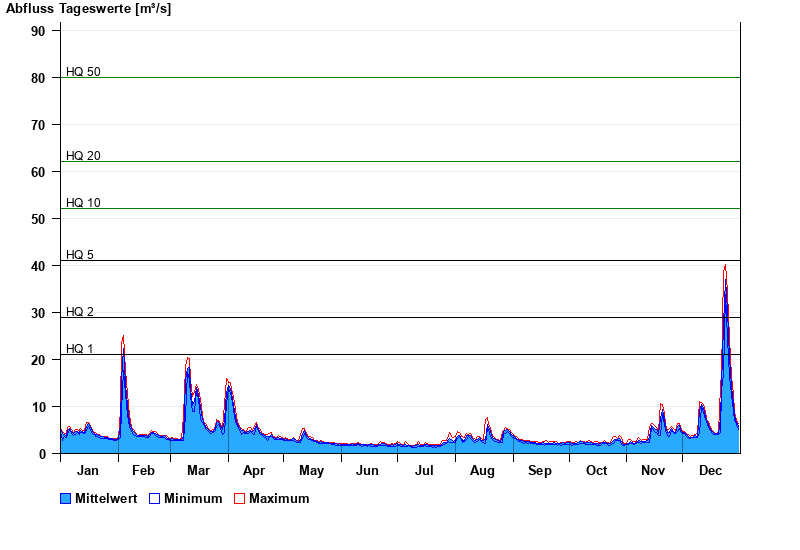
- HQ1 21 m³/s
- HQ2 29 m³/s
- HQ5 41 m³/s
- HQ10 52 m³/s
- HQ20 62 m³/s
- HQ50 80 m³/s
- HQ100 93 m³/s
| Date | Mean value [m³/s] | Maximum [m³/s] | Minimum [m³/s] |
|---|---|---|---|
| 31.12.2023 | 4.57 | 5.22 | 4.02 |
| 30.12.2023 | 5.51 | 5.96 | 5.05 |
| 29.12.2023 | 6.87 | 7.71 | 5.96 |
| 28.12.2023 | 9.52 | 11.3 | 7.71 |
| 27.12.2023 | 13 | 15.1 | 11.3 |
| 26.12.2023 | 18.8 | 23.1 | 15.4 |
| 25.12.2023 | 29.1 | 32.7 | 23.1 |
© Bayerisches Landesamt für Umwelt 2024