
- Start >
- Rivers >
- Discharge >
- Naab - Regen >
- Achsheim >
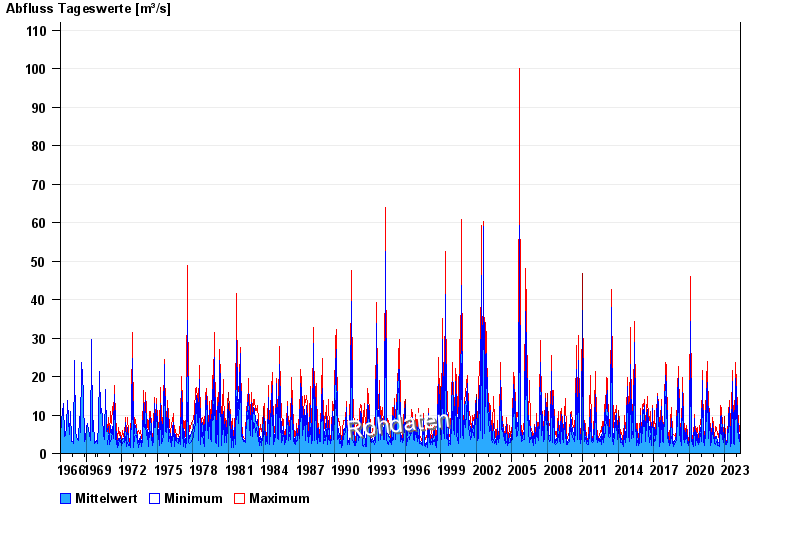
- Chart of total period

Chart of total period Achsheim / Schmutter
Discharge from 01.11.1966 to 27.04.2024
| Date | Mean value [m³/s] | Maximum [m³/s] | Minimum [m³/s] |
|---|---|---|---|
| 27.04.2024 | 2.4 | 2.64 | 2.3 |
| 26.04.2024 | 2.49 | 2.82 | 2.3 |
| 25.04.2024 | 2.49 | 3.21 | 2.3 |
| 24.04.2024 | 2.64 | 3.01 | 2.3 |
| 23.04.2024 | 2.7 | 3.01 | 2.14 |
| 22.04.2024 | 3.24 | 4.06 | 2.64 |
| 21.04.2024 | 3.07 | 4.06 | 2.82 |
© Bayerisches Landesamt für Umwelt 2024