
- Start >
- Rivers >
- Discharge >
- Unterer Main >
- Wüstenzell >
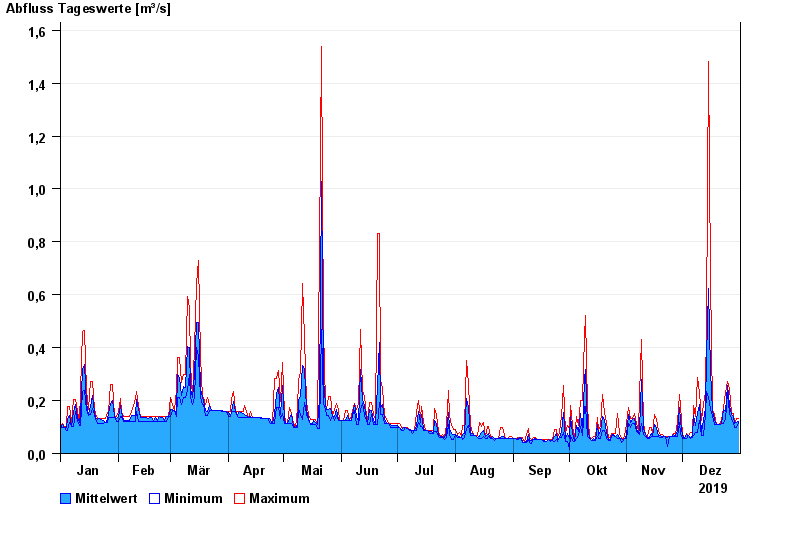
- Chart of year

Chart of year Wüstenzell / Aalbach
Discharge from 01.01.2019 to 31.12.2019
| Date | Mean value [m³/s] | Maximum [m³/s] | Minimum [m³/s] |
|---|---|---|---|
| 31.12.2019 | 0.12 | 0.134 | 0.116 |
| 30.12.2019 | 0.119 | 0.134 | 0.1 |
| 29.12.2019 | 0.113 | 0.115 | 0.1 |
| 28.12.2019 | 0.138 | 0.152 | 0.115 |
| 27.12.2019 | 0.147 | 0.152 | 0.132 |
| 26.12.2019 | 0.182 | 0.246 | 0.151 |
| 25.12.2019 | 0.256 | 0.273 | 0.232 |
© Bayerisches Landesamt für Umwelt 2024