
- Start >
- Rivers >
- Discharge >
- Unterer Main >
- Wüstenzell >
- Chart of total period

Chart of total period Wüstenzell / Aalbach
Discharge from 17.04.1920 to 29.04.2024
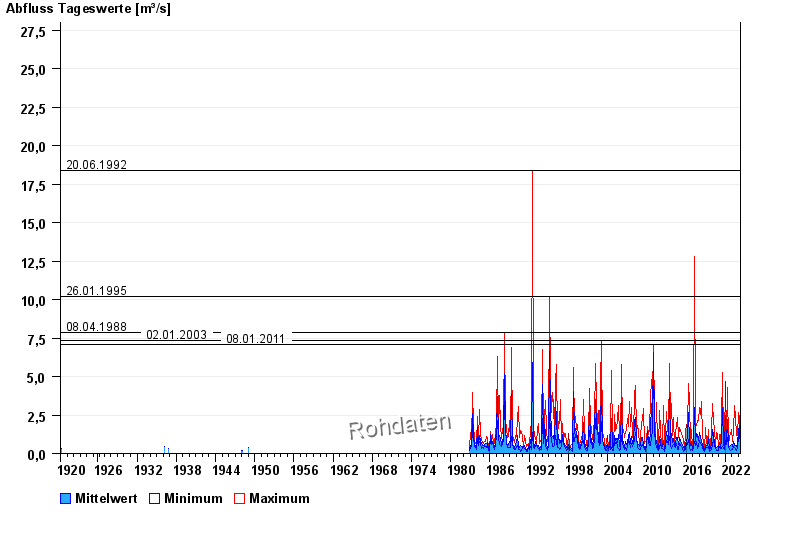
- 20.06.1992 Abfluss: 18,4 m³/s
- 26.01.1995 Abfluss: 10,2 m³/s
- 08.04.1988 Abfluss: 7,86 m³/s
- 02.01.2003 Abfluss: 7,36 m³/s
- 08.01.2011 Abfluss: 7,09 m³/s
| Date | Mean value [m³/s] | Maximum [m³/s] | Minimum [m³/s] |
|---|---|---|---|
| 29.04.2024 | 0.369 | 0.403 | 0.369 |
| 28.04.2024 | 0.369 | 0.369 | 0.369 |
| 27.04.2024 | 0.39 | 0.403 | 0.369 |
| 26.04.2024 | 0.403 | 0.403 | 0.403 |
| 25.04.2024 | 0.43 | 0.439 | 0.403 |
| 24.04.2024 | 0.422 | 0.439 | 0.403 |
| 23.04.2024 | 0.441 | 0.476 | 0.439 |
© Bayerisches Landesamt für Umwelt 2024