
- Start >
- Rivers >
- Discharge >
- Unterer Main >
- Weilbach >
- Chart of year

Chart of year Weilbach / Mud
Discharge from 06.10.2023 to 05.10.2024
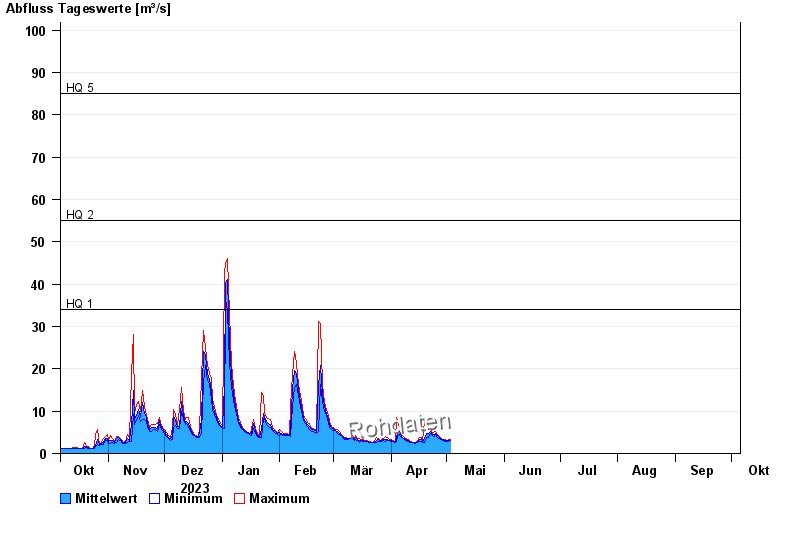
- HQ1 34 m³/s
- HQ2 55 m³/s
- HQ5 85 m³/s
- HQ10 105 m³/s
- HQ20 130 m³/s
- HQ50 155 m³/s
- HQ100 180 m³/s
| Date | Mean value [m³/s] | Maximum [m³/s] | Minimum [m³/s] |
|---|---|---|---|
| 27.07.2024 | 3.99 | 5.75 | 1.98 |
| 26.07.2024 | 1.91 | 2.09 | 1.8 |
| 25.07.2024 | 1.88 | 1.98 | 1.71 |
| 24.07.2024 | 1.98 | 2.19 | 1.8 |
| 23.07.2024 | 2.03 | 2.19 | 1.89 |
| 22.07.2024 | 2.23 | 2.29 | 2.09 |
| 21.07.2024 | 2.21 | 2.63 | 2.09 |
© Bayerisches Landesamt für Umwelt 2024